|
Cost to find bugs
Why are there Bugs in Software?
(Continued from previous question...)
Cost to find bugs
There are 2 basic scenarios:
(1) Bugs reported by a Customer, which includes the cost to get a fix back to the customer
(2) Bugs detected and fixed internally which do not need to be reported to the customer
Assumptions:
(1) The bug is actually fixed
(2) This describes the Pre-Live/Beta/Field Test process. A "Live" customer reports issues directly to Support.
(3) The average salaries used are on the attached worksheet
(4) The time and cost to produce a new software package/release is not included (~ 1 day turnaround)
(5) The exact costs for the working environment (desk space, light, heat, benefits, workstation, etc.) are not included
Legend: (Acronyms used)
QA = Quality Assurance (Testers)
SA = System (Business) Analysts
SE = Software Engineer (Developer)
Average Cost to Detect and Fix a bug
|
Who
|
Action
|
Avg. Time spent (Hours)
|
Scenario 1 - Cost
|
Scenario 2 - Cost
|
|
Customer
|
(1) finds a bug, (2) reports it to Consultant
|
1
|
unknown
|
|
|
Consultant
|
(1) verifies that the bug exists, (2) reports the issue to Support
|
0.5
|
$145.00
|
|
|
Support
|
(1) reproduces the bug, (2) reports it to Engineering
|
1
|
$217.50
|
|
|
QA
|
verifies the issue on (1) testing machines, (2) the latest dev't builds
|
0.5
|
$10.26
|
$10.26
|
|
SA
|
identifies the critical areas affected and provides more information
|
3
|
$107.69
|
$107.69
|
|
SE
|
provides the fix or workaround as appropriate
|
4
|
$143.59
|
$143.59
|
|
SA
|
verifies technical fix
|
1
|
$35.90
|
$35.90
|
|
QA
|
verifies user-level fix, Admin notifies Support
|
0.5
|
$10.26
|
$10.26
|
|
Support
|
(1) confirms fix, (2) notifies consultant
|
1
|
$217.50
|
|
|
QA
|
verifies user-level fix, Admin notifies Support
|
0.5
|
$10.26
|
$10.26
|
|
Consultant
|
notifies customer of fix or workaround
|
0.5
|
$145.00
|
|
|
|
Totals:
|
|
$1032.69
|
$307.69
|
|
Number of issues reported from 1-March-06 (8:00 AM) to 21-May-06 (5:00 PM):
|
By Customers
|
By QA
|
|
# Urgent :
|
0
|
1
|
|
# High
|
33
|
29
|
|
# Medium :
|
10
|
29
|
|
# Low :
|
6
|
16
|
|
Total =
|
49
|
75
|
|
Average cost to fix issues =
|
$50,601.92
|
$23,076.92
|
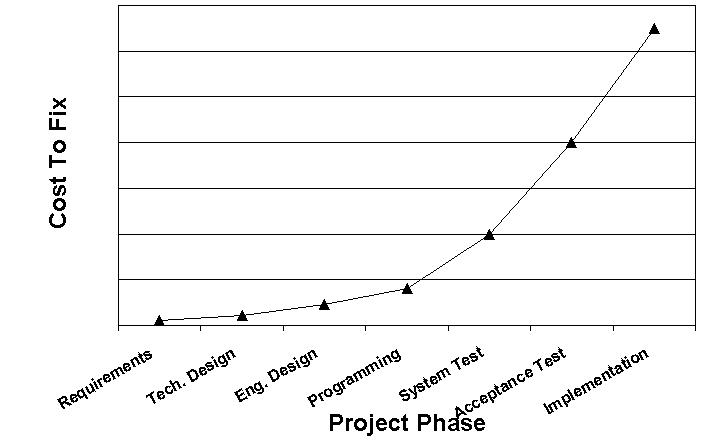
Reference Chart taken from a hardcopy presentation. Original reference, numbers and data unavailable.
Percentage estimates used to reproduce this diagram. Cost estimates above can be used to create a similar diagram depending on the phases in your Software Development Life Cycle.
Other Interview Questions
|