<< Running Tests - Generating a testplan Pass/Fail chart | Running Tests - Changing advanced properties >>
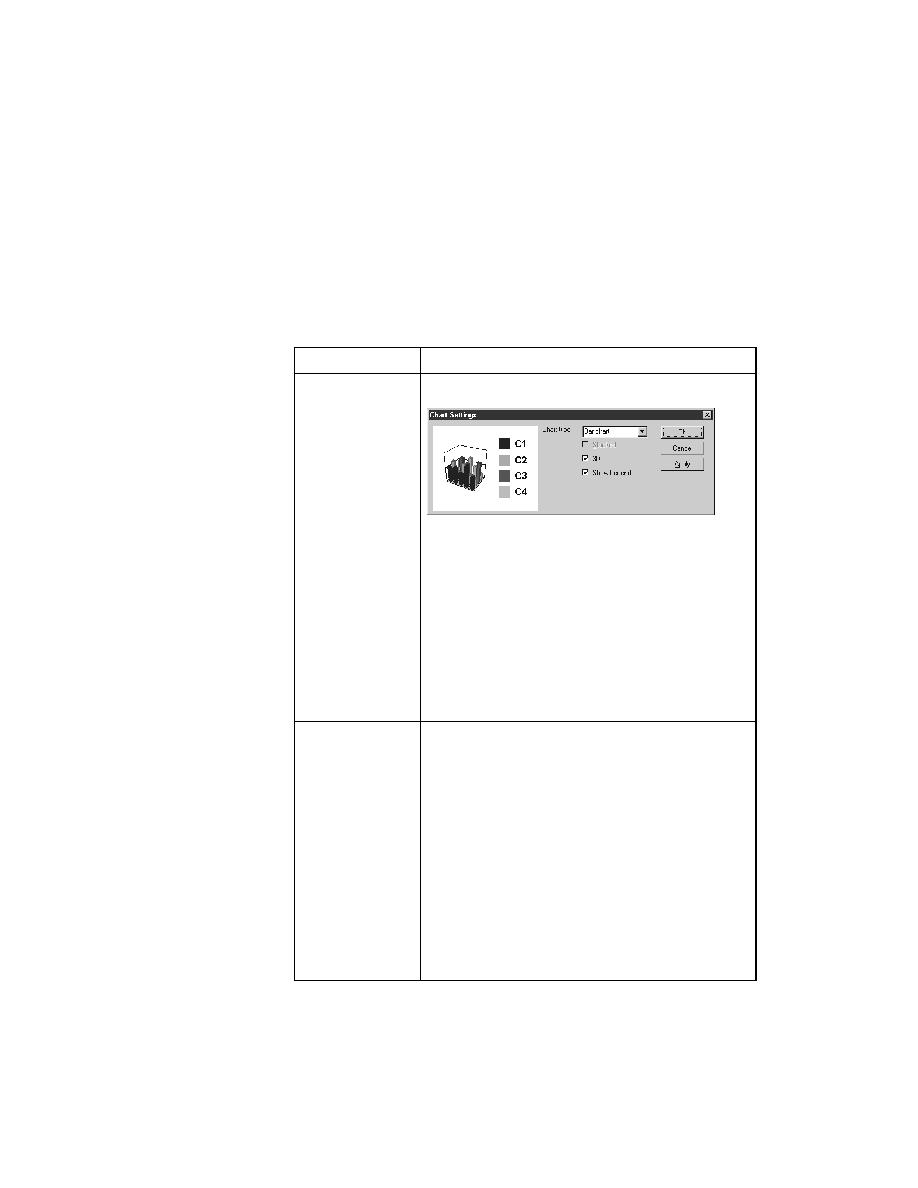
Running Tests - Change basic charting properties
<< Running Tests - Generating a testplan Pass/Fail chart | Running Tests - Changing advanced properties >>
the chart well.
testplan Pass/Fail report" on page 162, a default chart is displayed,
which allows you to modify chart parameters before actually
generating the chart.
charting properties
Chart Type drop-down list box. QA Organizer
provides bar charts, line charts, and area charts. Click
Apply to update the chart and leave the Chart Settings
dialog open.
dimensional, is stacked (for bar charts), and displays a
legend, which describes the data being charted.
the chart will look based on current settings.
from another
execution of the
testplan to the chart
listing recent runs of the current testplan.
testplan. The number of results it keeps is determined
by the value for History Size in the Runtime Options
dialog.
results from the selected execution of the testplan will
be added to the results currently charted.
of the same tests to spot problem areas. You can chart
today's results, then click Setup and select yesterday's
results to have both appear on one chart.