Running Tests - Changing advanced properties
User's Guide
167
6 R
UNNING
T
ESTS
AND
I
NTERPRETING
R
ESULTS
Managing results file information
Changing advanced
properties
Usually you can get the chart you want using the default and basic charting
properties. But if you want more customization, you can modify just about
any property in the chart. For example, you can:
·
Change the text that appears for the title and footnote
·
Change the font used for any text in the chart
·
Specify the location for the title, legend, and footnote
·
Change the colors used for the data
·
Change the size and spacing of the bars in bar charts
·
Add borders and shading to the background (backdrop) of any area
Procedure To fully customize a chart:
1
Generate the Pass/Fail report and select the Chart tab.
2
Click the area of the chart that you want to customize.
The area is selected. The following figure shows the titled selected.
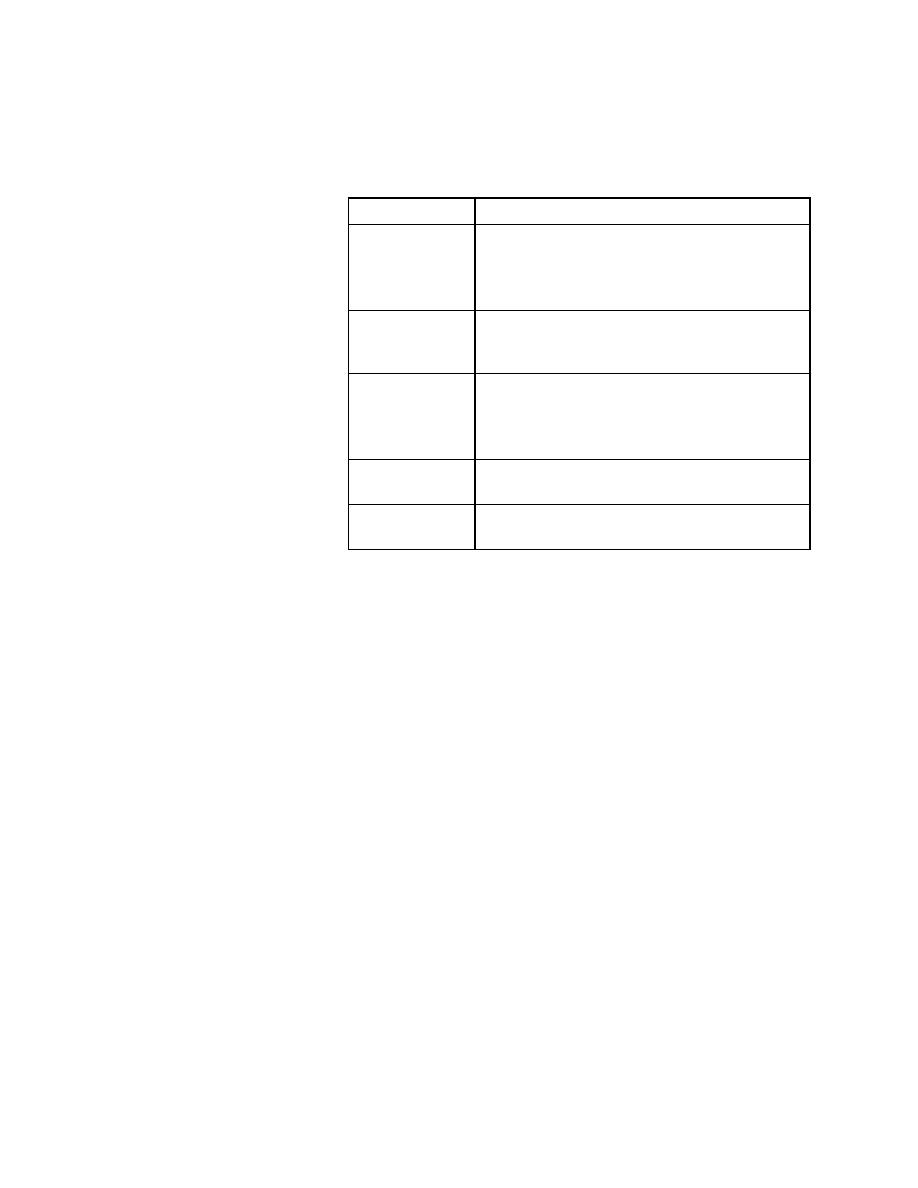
Move a part of the
chart
Click the part you want to move, such as the title,
legend, or footnote
(the text that displays below the
chart)
. The area is selected.
Drag it with the mouse.
Print the chart
Click Print. The Print Pass/Fail Chart dialog displays.
You can specify a header or footer. Click OK to print
the chart.
Copy the chart to
the clipboard
Press the right mouse button anywhere on the
displayed chart. Select Copy from the popup menu.
The chart is placed on the clipboard. You can paste it
into another application.
Change advanced
charting properties
Generate the chart
Once you are satisfied with the chart parameters, click
Generate. The Pass/Fail chart is displayed.
If you want to
Then