<< Running Tests - Including results of manual tests | Running Tests - Change basic charting properties >>
Running Tests - Generating a testplan Pass/Fail chart
<< Running Tests - Including results of manual tests | Running Tests - Change basic charting properties >>
If you later generate a report using these results, the merged manual
results will be used, not the manual results that are current.
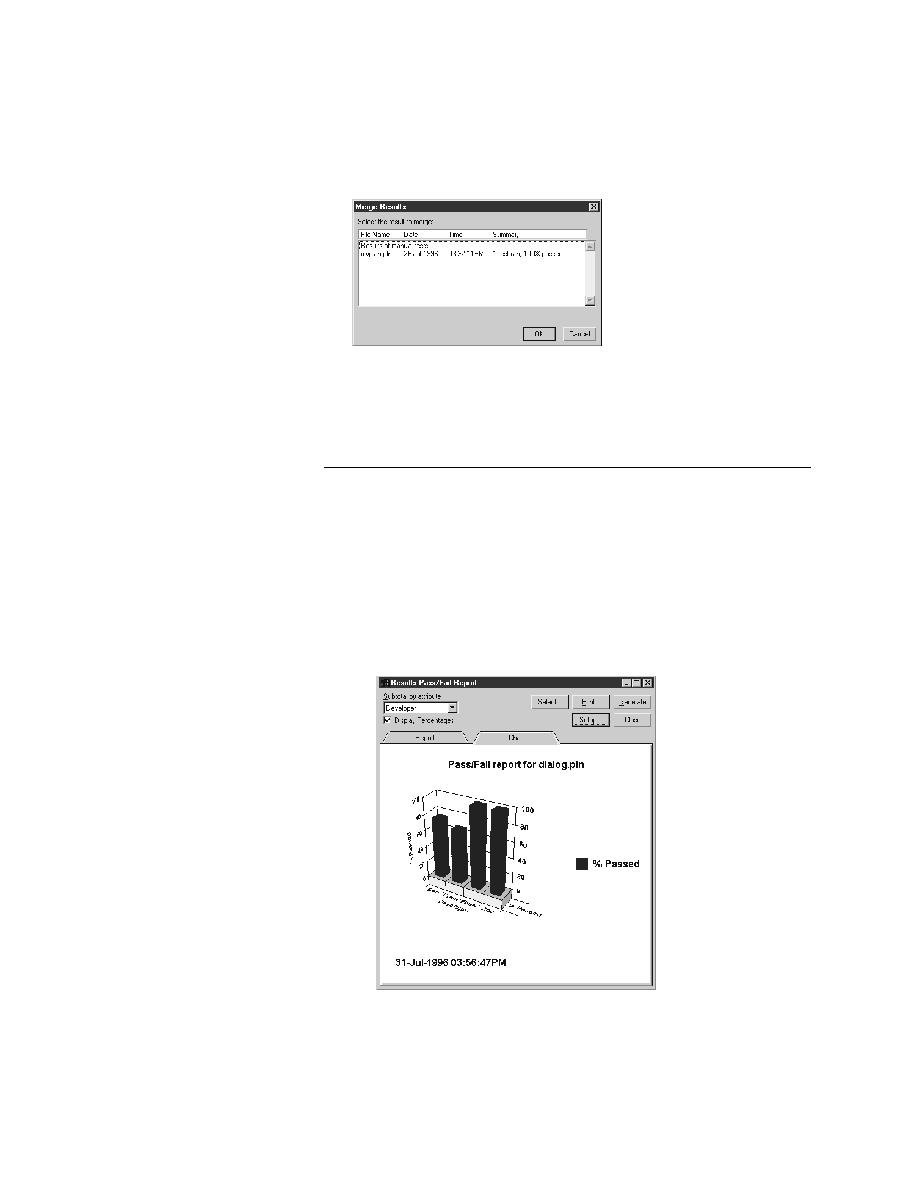
information as a graph, or you can directly graph the testplan results
information without a preexisting report.
Pass/Fail chart
is displayed, as shown in the following figure.