Analyzing Metrics
Managing Project Status
111
2
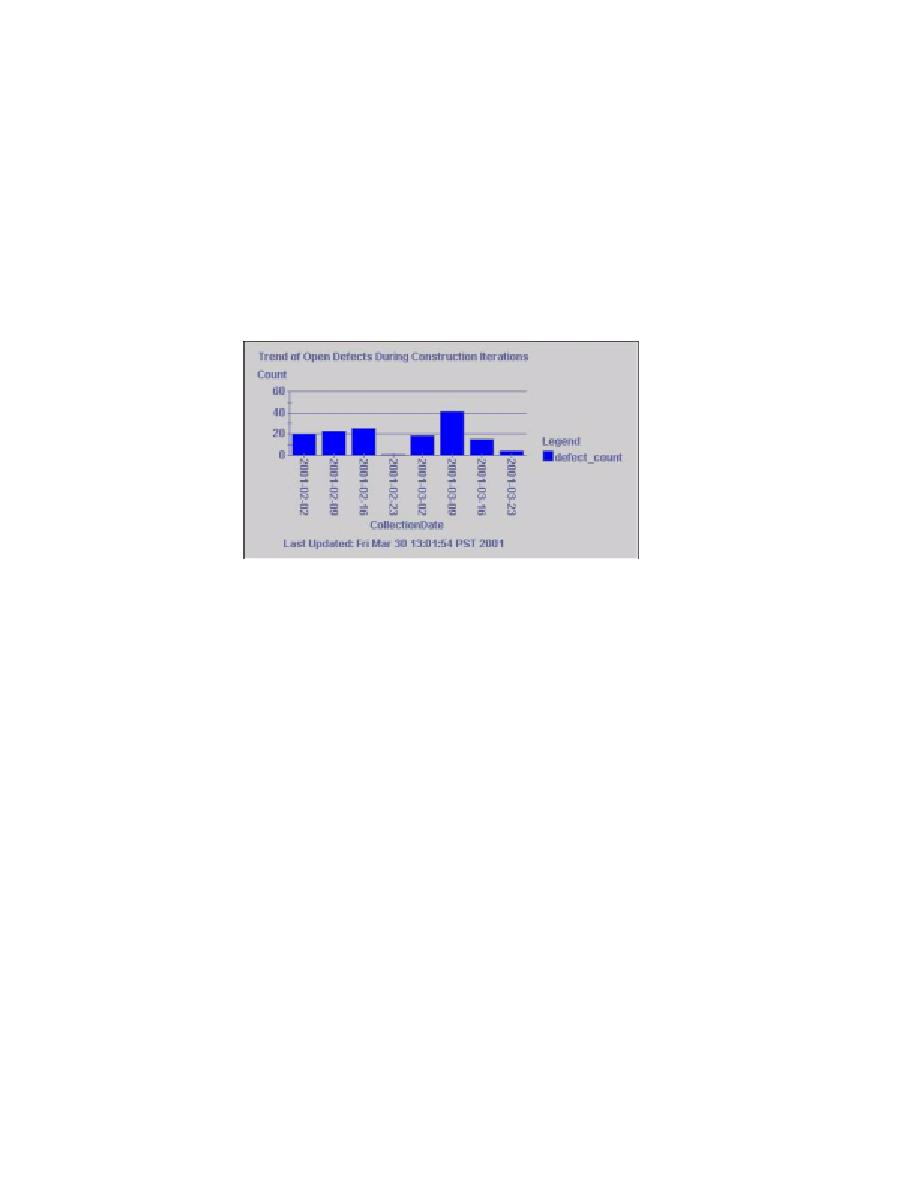
Scroll to Trend Chart 1, Trend of Open Defects During Construction Iterations (see
Figure 34).
This chart shows the trend of open defects over time. From this trend, we
determine that the developers are successful at stabilizing the application by the
end of each construction iteration.
Figure 34
Working with Trend Charts Using ProjectConsole
3
Optional: Review the other trends charts on this page.
4
Quit the ClassicsCD.com project Web site.
Analyzing Metrics
ProjectConsole also provides a dynamic metric analysis tool, the Dashboard, which
helps you drill-down and perform root-cause analysis. Although working with the
Project Console Dashboard is beyond the scope of this tutorial, you can learn more
about it by reading
Getting Started: Rational ProjectConsole.