Using ProjectConsole Metrics to Understand Project Status
110
Chapter 8 - Communicating Project Status
Working with Project Metrics
ProjectConsole extracts information from data produced throughout a software
development project and automatically generates graphics, such as charts and
gauges, either predefined or ones that you customize. These metrics allow you to
automatically collect information about the status of your project and share it with
members of your team. With ProjectConsole, you can also analyze data in a single,
integrated view collected from several Rational tools.
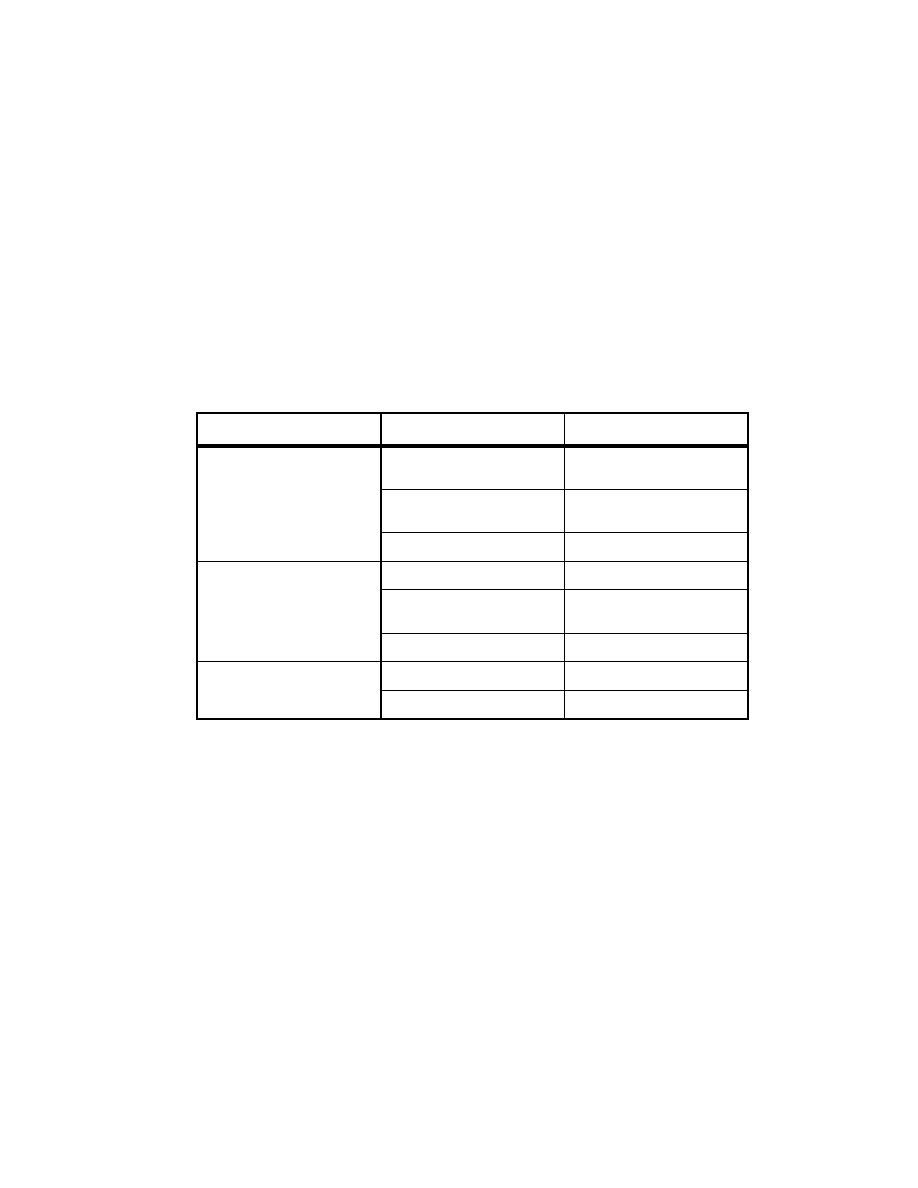
Table 3 shows you how ProjectConsole is used to measure progress and quality.
Exercise: View and analyze project metrics.
1
In the tree browser, go to Project Manager > Metrics Reports by Phase > Development >
Construction
.
A page containing information about the Construction phase of ClassicsCD.com
Version 2 iteration appears. Read the introductory paragraphs. This information
explains what you are working on in this tutorial.
Table 3
Using ProjectConsole Metrics to Understand Project Status
Use ProjectConsole to
by gathering data about
using
Determine whether your
application or product is
stabilizing
Lines of code being added,
modified, or deleted
ClearCase LT
Visual models being added,
modified, or deleted
Rose
Reported defects
ClearQuest
See how many additional
tasks must be performed in
this iteration
Open defects
ClearQuest
Open features, use cases, and
requirements
RequisitePro
Open test cases
TestManager
Assess the quality of your
application or product
Open defects by severity
ClearQuest
Trend of test results
TestManager