Generating Graphs
TestDirector Tutorial
Generating Graphs
TestDirector graphs help you analyze the relationships between different
types of data in a project. Depending on the TestDirector module you are in,
you have different graph options. After you generate a graph, you can
customize graph properties to display information according to your
specifications.
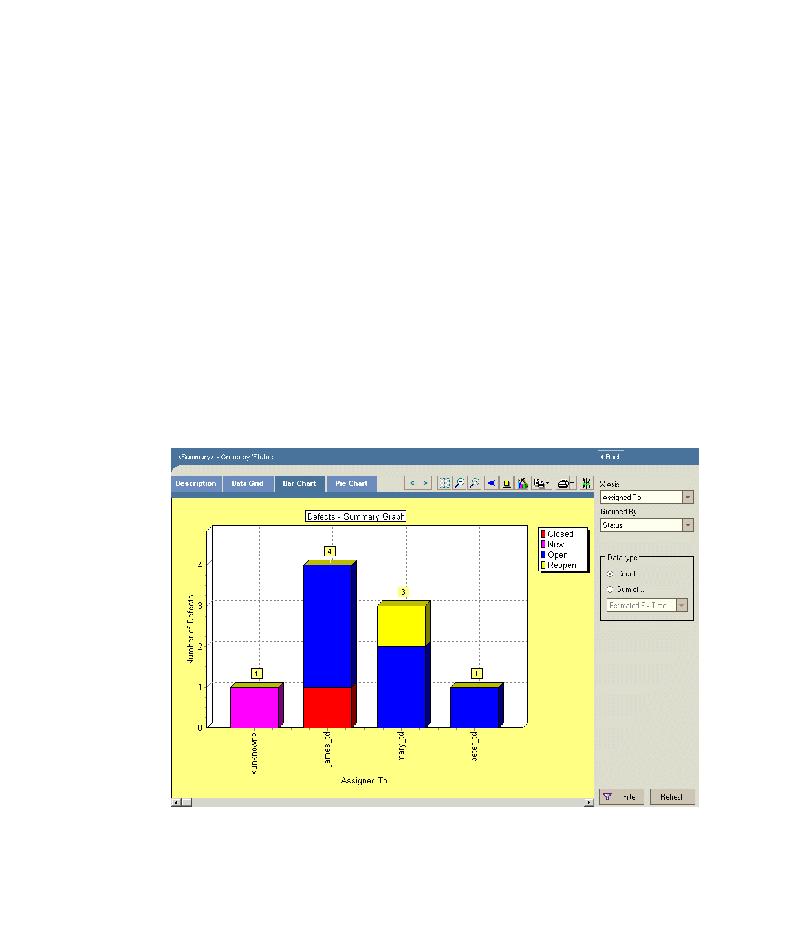
In the following exercise, you will generate a defects graph to summarize the
defects by status and priority level.
To generate a graph:
1 Display the Defects module.
Click the Defects tab. The Defects module displays the Defects Grid.
2 Choose a graph.
Choose Analysis > Graphs > Summary. The Defects Summary graph opens.
By default, the graph is grouped by defect status.
100