Debugger - Starting the debugger
172
User's Guide
7 U
SING
THE
D
EBUGGER
Starting the debugger
Starting the debugger
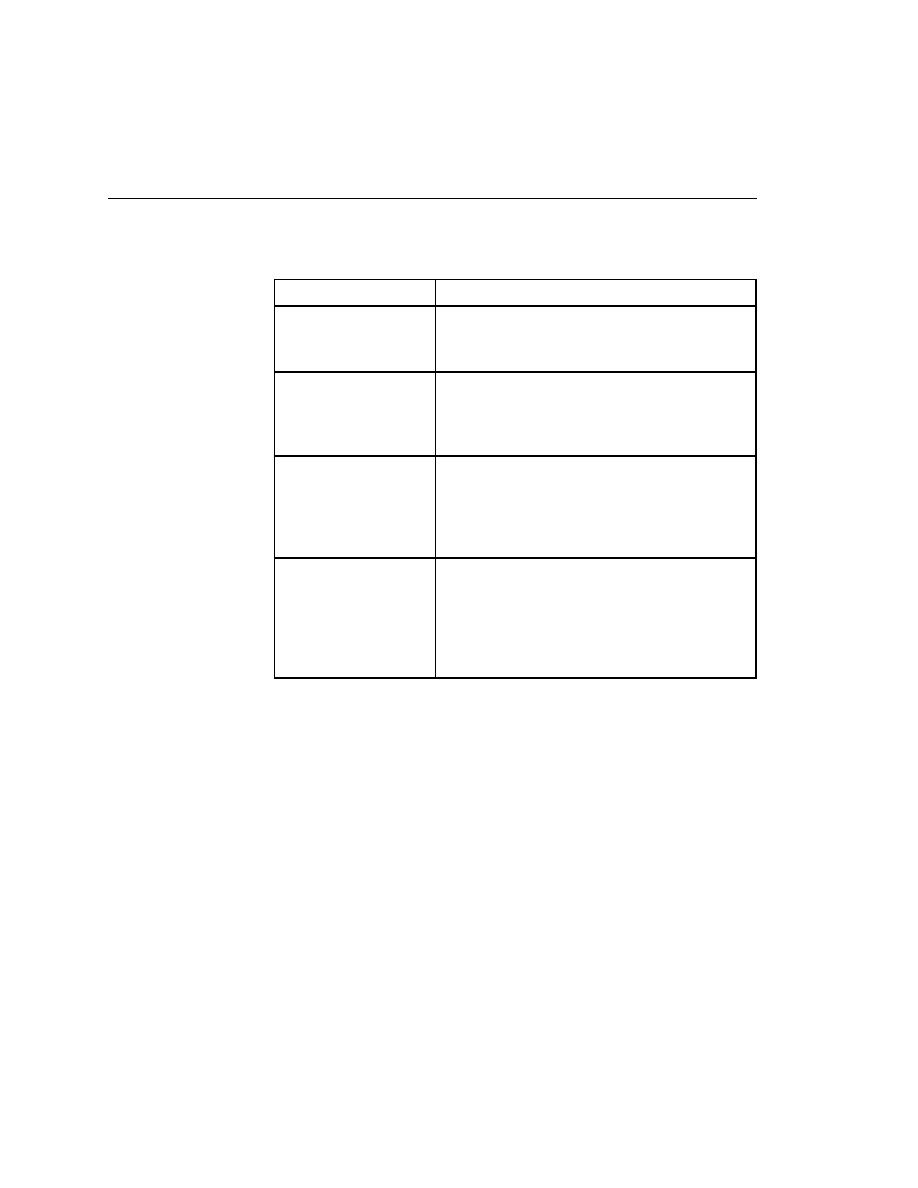
There are several ways to enter the debugger, as shown in the following table:
When you enter the debugger, you can execute the script under your control
(but note that you cannot edit a script when you are in the debugger).
The following figure shows the debugging environment.
If you want to debug
Then
The script in the active
window
· Select Run/Debug.
SilkTest enters the debugger and pauses; it does
not set a breakpoint.
Another script
· Select File/Debug and select the script file from
the Debug dialog.
SilkTest enters the debugger and pauses; it does
not set a breakpoint.
A testcase
· With a script active, select Run/Testcase, select a
testcase from the Run Testcase dialog, and click
the Debug pushbutton.
SilkTest enters the debugger and sets a
breakpoint at the first line of the testcase.
An application state
· Select Run/Application State, select an
application state from the Run Application State
dialog, and click the Debug pushbutton.
SilkTest enters the debugger and sets a
breakpoint at the first line of the application state
definition.