The Code Coverage item
Viewing the Results of a Test Suite Run
6-7
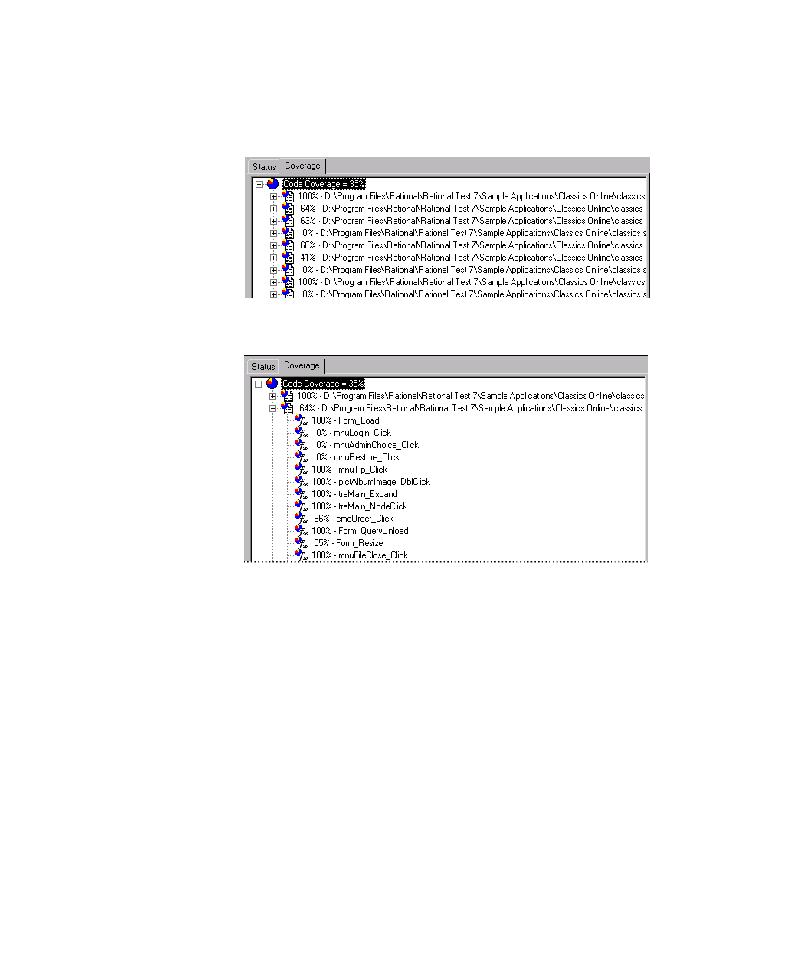
2. To see code coverage for the source files, expand the Code Coverage item. The
tree lists every source file in the AUT and the aggregate code coverage values for
the scripts that touched them.
3. To see the coverage values for individual procedures within a source file, expand
the source file.
4. If you instrumented the source files for the AUT, then you can view the source
code for a procedure in the Coverage Browser. To open the Coverage Browser,
double-click the procedure.
Viewing Logs for Scripts in a Test Suite
You can access the logs for every script run in the Test Suite through the individual
script objects in the application map. For information about viewing logs, see
Viewing the Log for a Defect Script on page 5-17.