Opening Network Monitor Graphs
Monitoring · Network Monitoring
LoadRunner Controller User's Guide (Windows)
Chapter 20, page 332
In
Opening Network Monitor Graphs
In order to view the network monitor graph, you need to activate network monitoring
before running a scenario. For more information, see
Setting the Network
Monitor
on page 329.
To view the Network monitor:
1
Run a scenario.
2
If Auto Load Analysis is disabled, click Tools > Analysis to open the LoadRunner
Analysis.
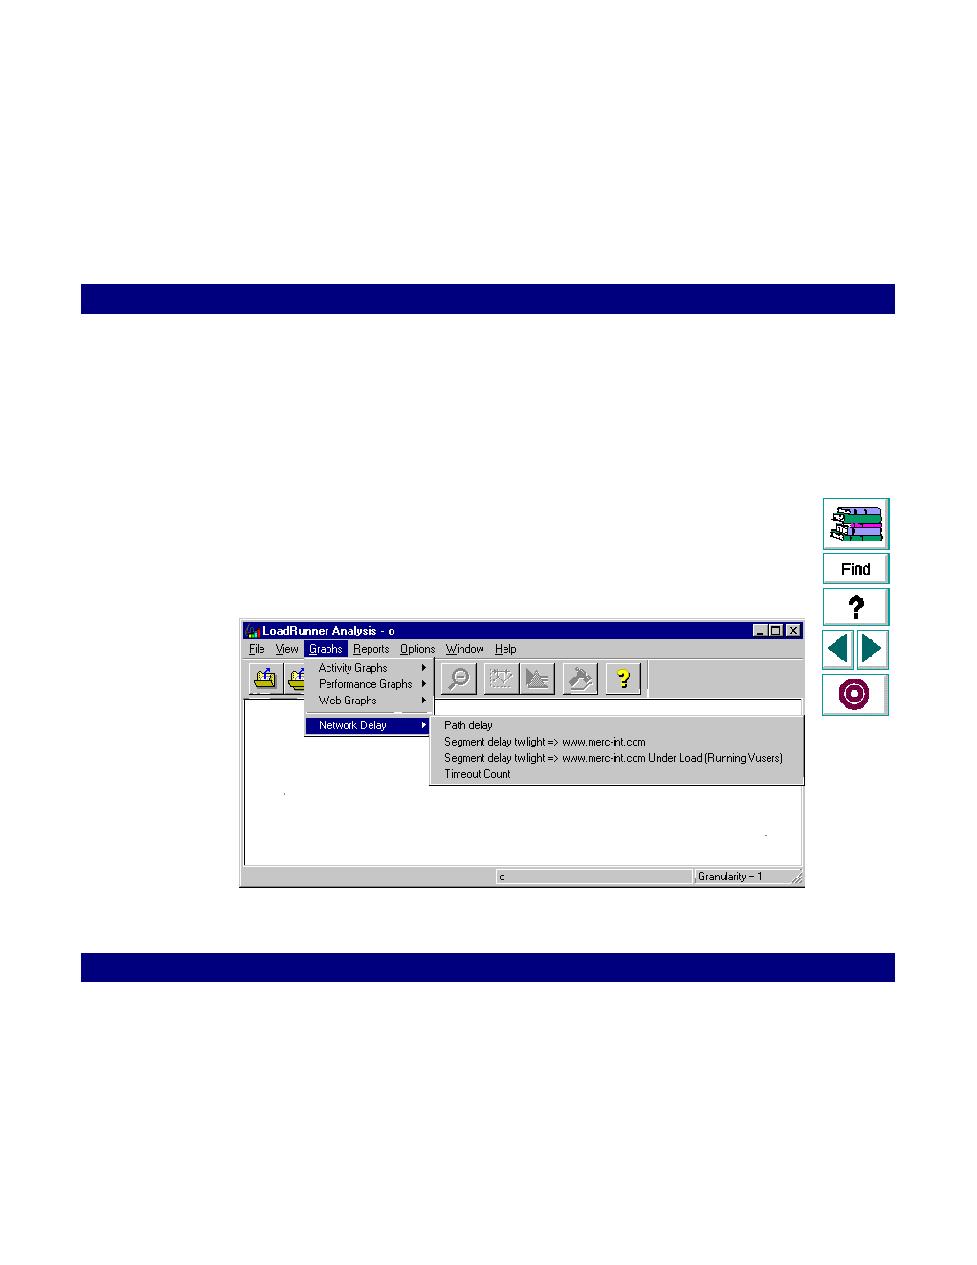
3
Open the desired Network graph--either a specific segment or the entire path.
Choose Graphs > Network Delay >
graph_name
.
A graph is available for each segment and path that you indicated earlier in the
monitor settings.