determine the problematic node.
Monitoring · Network Monitoring
LoadRunner Controller User's Guide (Windows)
Chapter 20, page 333
4
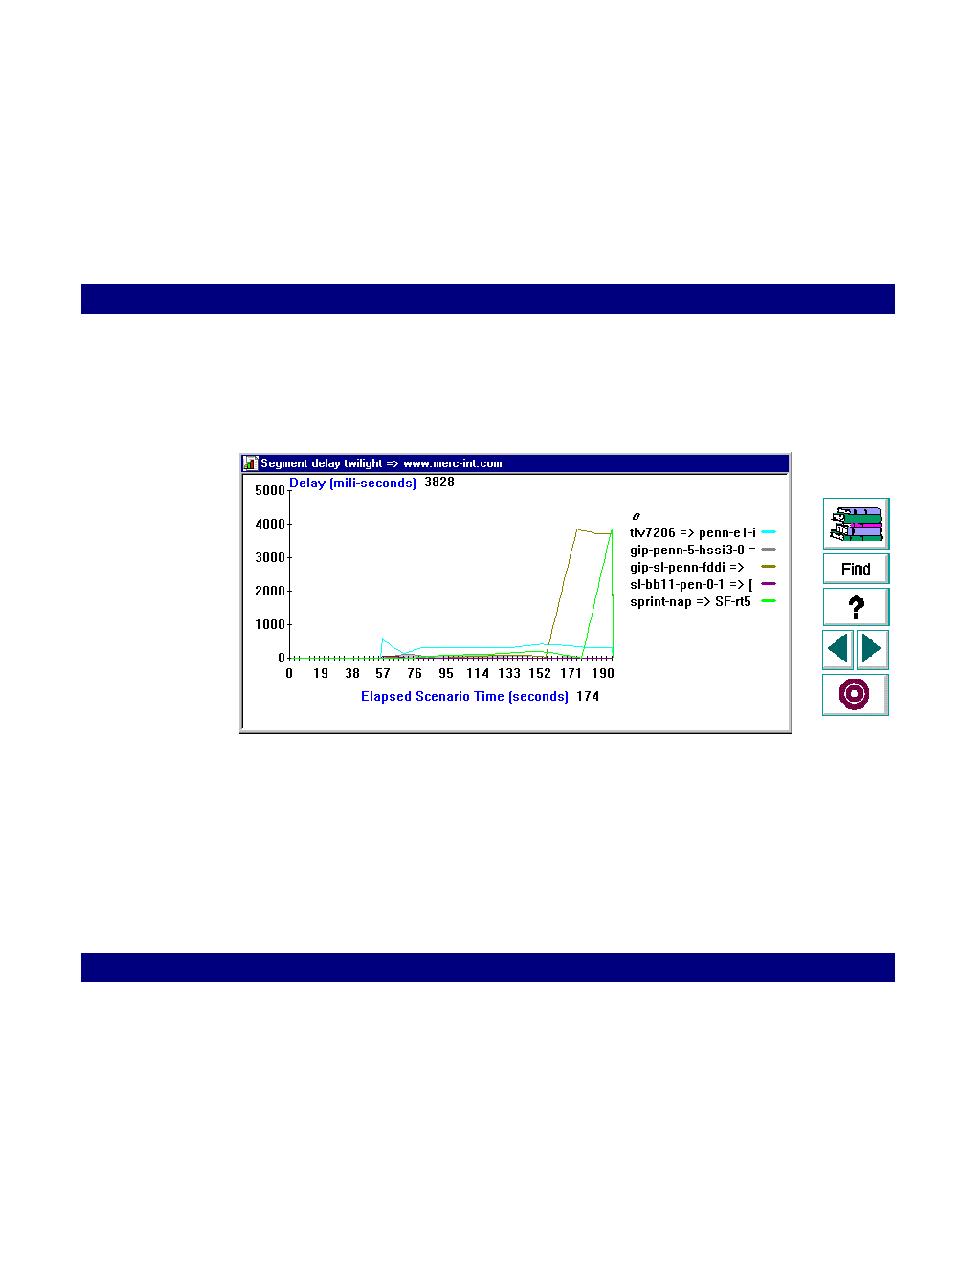
View the graph and determine the problematic node. In the following graph the
problematic node is the one peaking at 4000 milliseconds--
gip-sl-penn-fddi
.
5
Perform the necessary operations such as modifying the application, upgrading,
or bypassing the node.
6
Repeat steps 1-5 until the network results are satisfactory.