Segment Delay Graph
Monitoring · Network Monitoring
LoadRunner Controller User's Guide (Windows)
Chapter 20, page 322
In
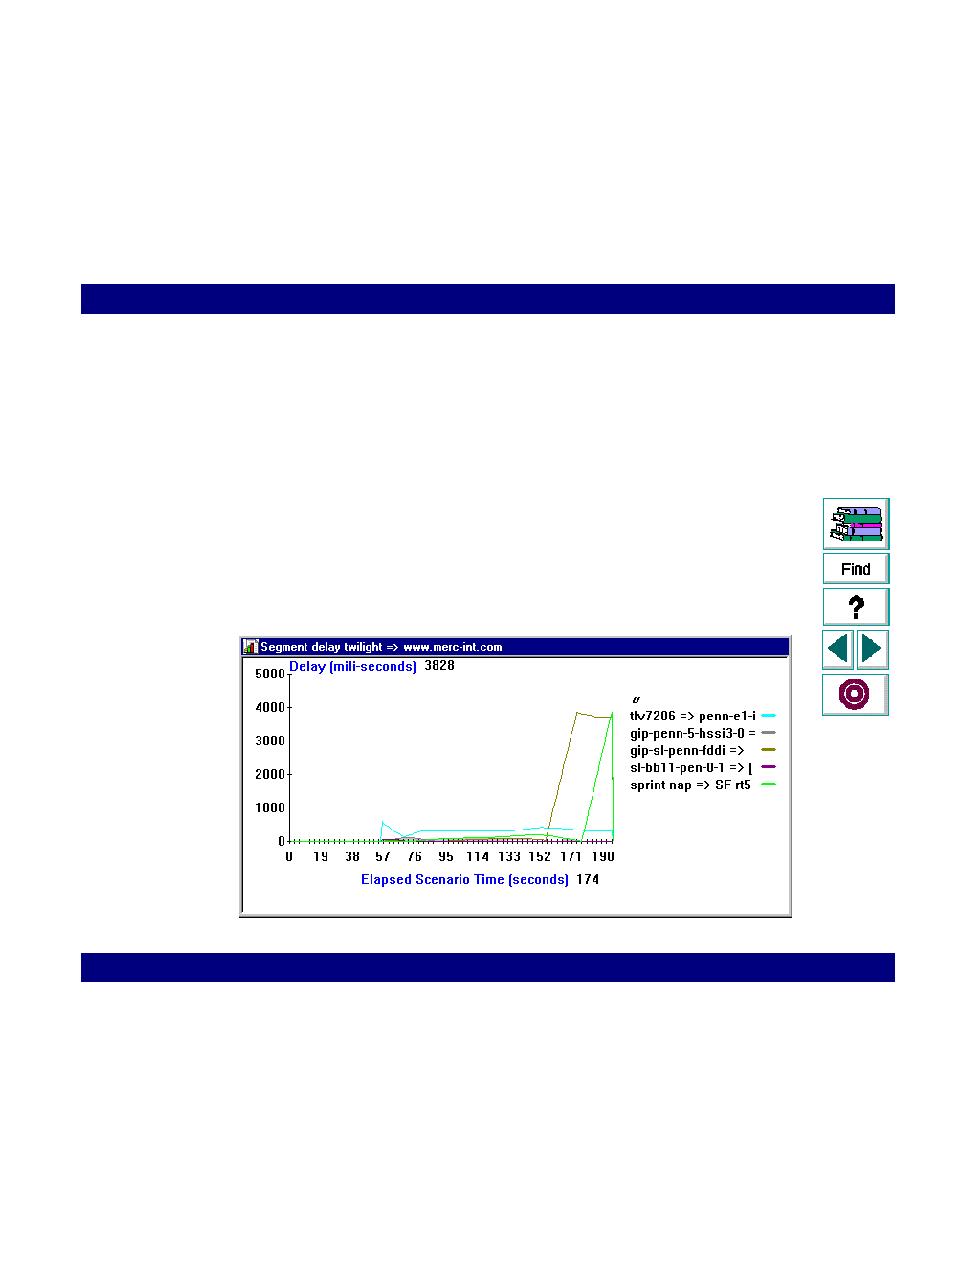
Segment Delay Graph
The Segment Delay graph shows the delay for each segment of the path
according to the elapsed scenario time.
The title bar indicates the full network path. The individual segment names are
indicated by their source and destination nodes. The source node is displayed
without a domain.
In the following example, there are five segments, but two of them are filtered out.
The graph displays only three segments. The
gip-sl-penn-fddi
segment caused a delay of 4 seconds in the 160th second.