Path Delay Graph
Monitoring · Network Monitoring
LoadRunner Controller User's Guide (Windows)
Chapter 20, page 321
Path Delay Graph
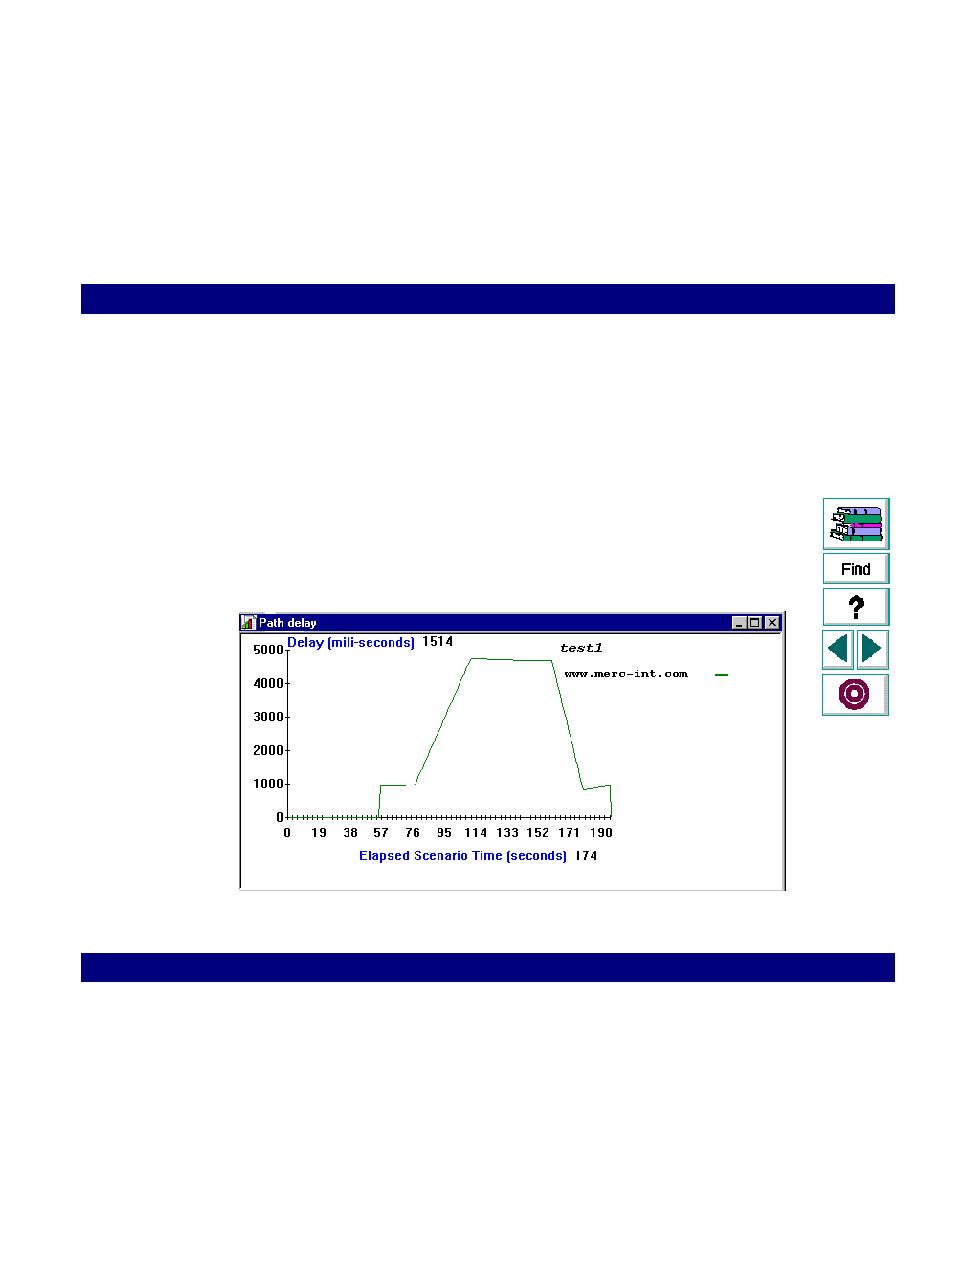
The Path Delay graph shows the delays for the complete path between the
source and destination machines (for example the database server and Vuser
host). The graph maps the delay as a function of the elapsed scenario time.
Each path defined in the Controller is represented by a line in the graph.
The following graph shows the path between the twilight source machine and
www.merc-int.com. It shows a delay of 4,600 milliseconds in the 105th second of
the scenario.