Timeout Count Graph
Monitoring · Network Monitoring
LoadRunner Controller User's Guide (Windows)
Chapter 20, page 323
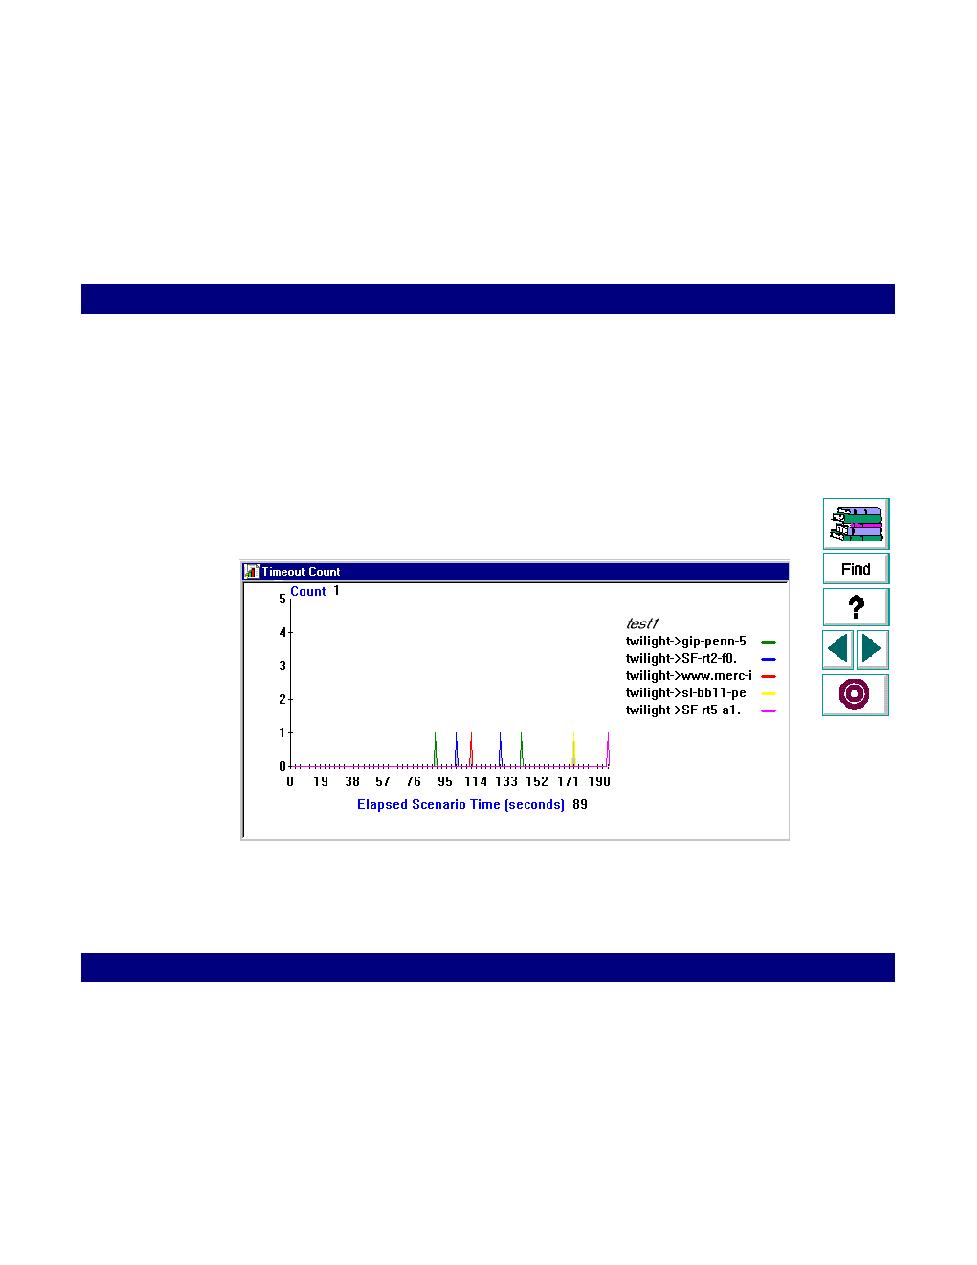
Timeout Count Graph
The Timeout Count graph shows when network timeouts occurred during the
scenario. LoadRunner sends a packet of information and if the packet does not
return before the timeout period, it is indicated in the Timeout Count graph.
Each segment is displayed with a different color line. The segments are identified
by the source destination nodes.
In the following example, timeouts occurred at 80, 105, 112, 125, 140, 175, and 190
seconds into the scenario.
If no timeouts occurred, a graph is not generated. You set the timeout period from
the Configuration dialog box. For more information, see
Configuring the
Network Monitor
on page 327. Compare this graph to the Path Delay graph to
determine how each timeout affected the delay for that path.
