<< Transaction Performance Summary Graph and Report
|
Transaction Performance by Vuser Graph and Report >>
<< Transaction Performance Summary Graph and Report
|
Transaction Performance by Vuser Graph and Report >>
The report shows similar information
Analyzing Test Results · Analyzing Scenario Performance
LoadRunner Controller User's Guide (Windows)
Chapter 15, page 256
In
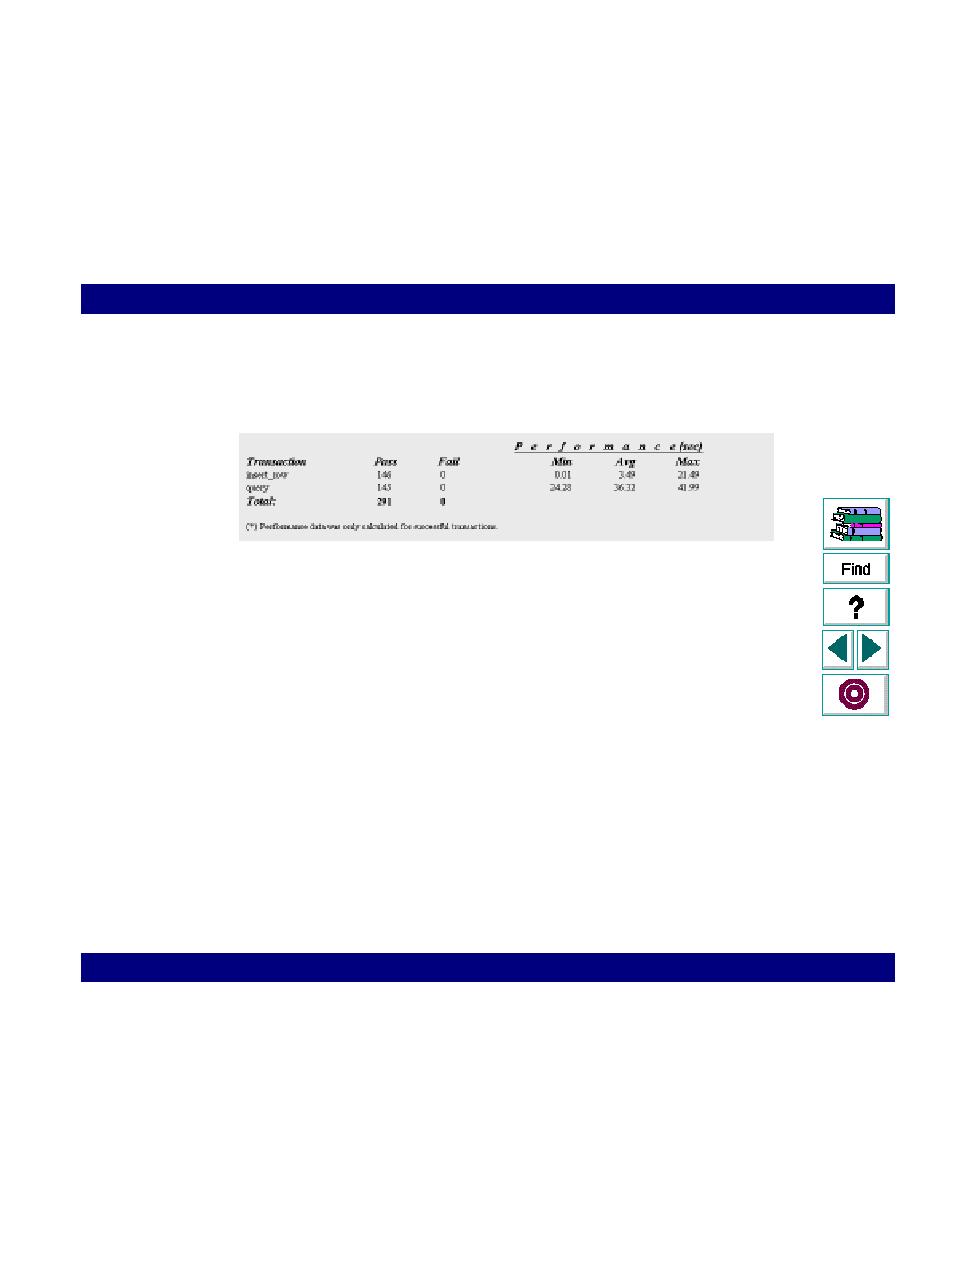
The report shows similar information in table form. The information in the table is
not rounded off to the nearest second, as it is in the graph.