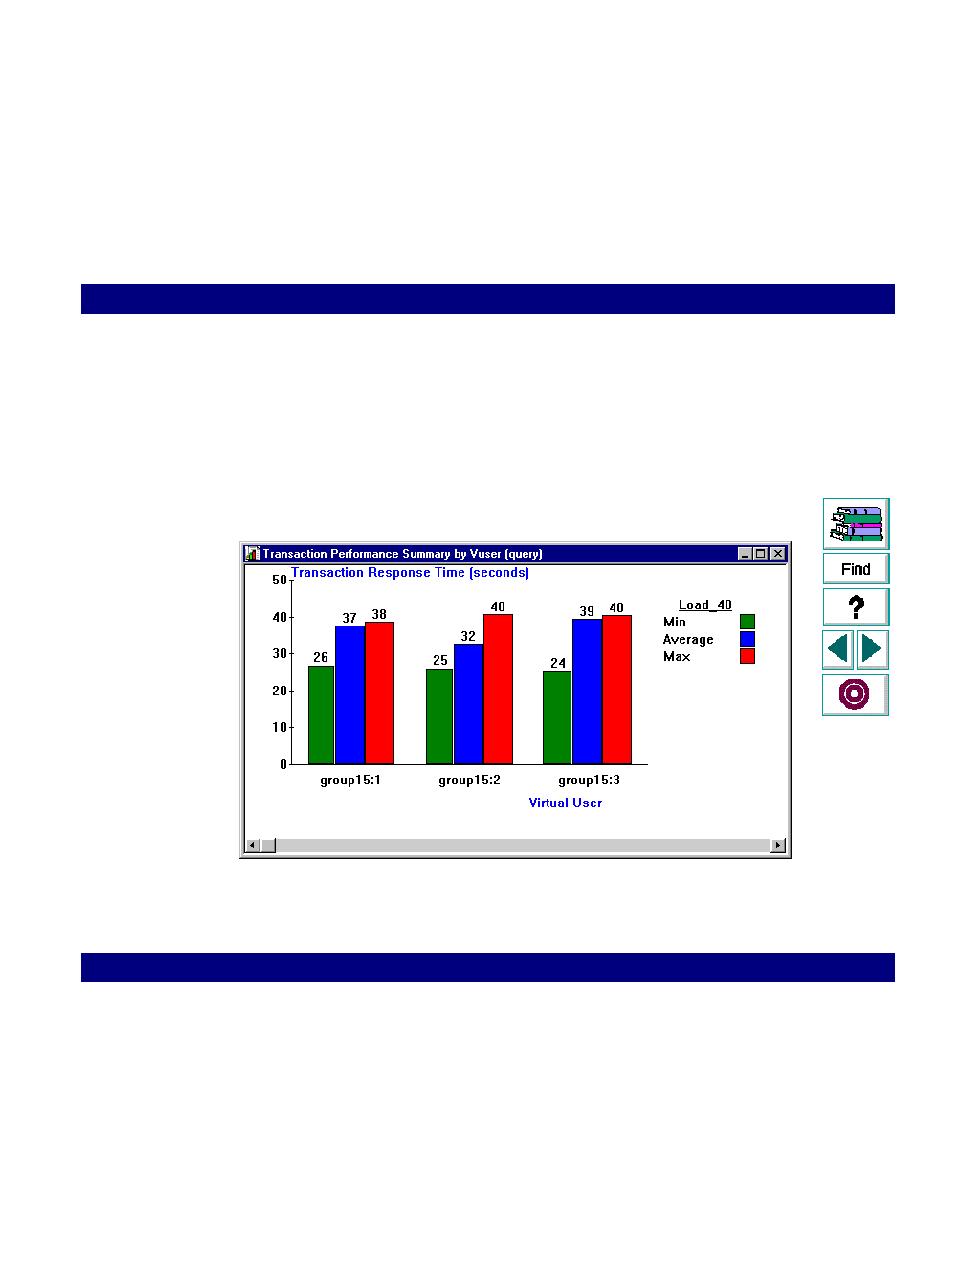
Transaction Performance by Vuser Graph and Report
an individual Vuser to perform transactions during the scenario. The minimum,
maximum, and average times are plotted for each transaction performed by the
Vuser. This graph is useful when you have different types of Vusers in a scenario,
and you want to characterize performance for each type.