Transaction Performance Summary Graph and Report
Analyzing Test Results · Analyzing Scenario Performance
LoadRunner Controller User's Guide (Windows)
Chapter 15, page 255
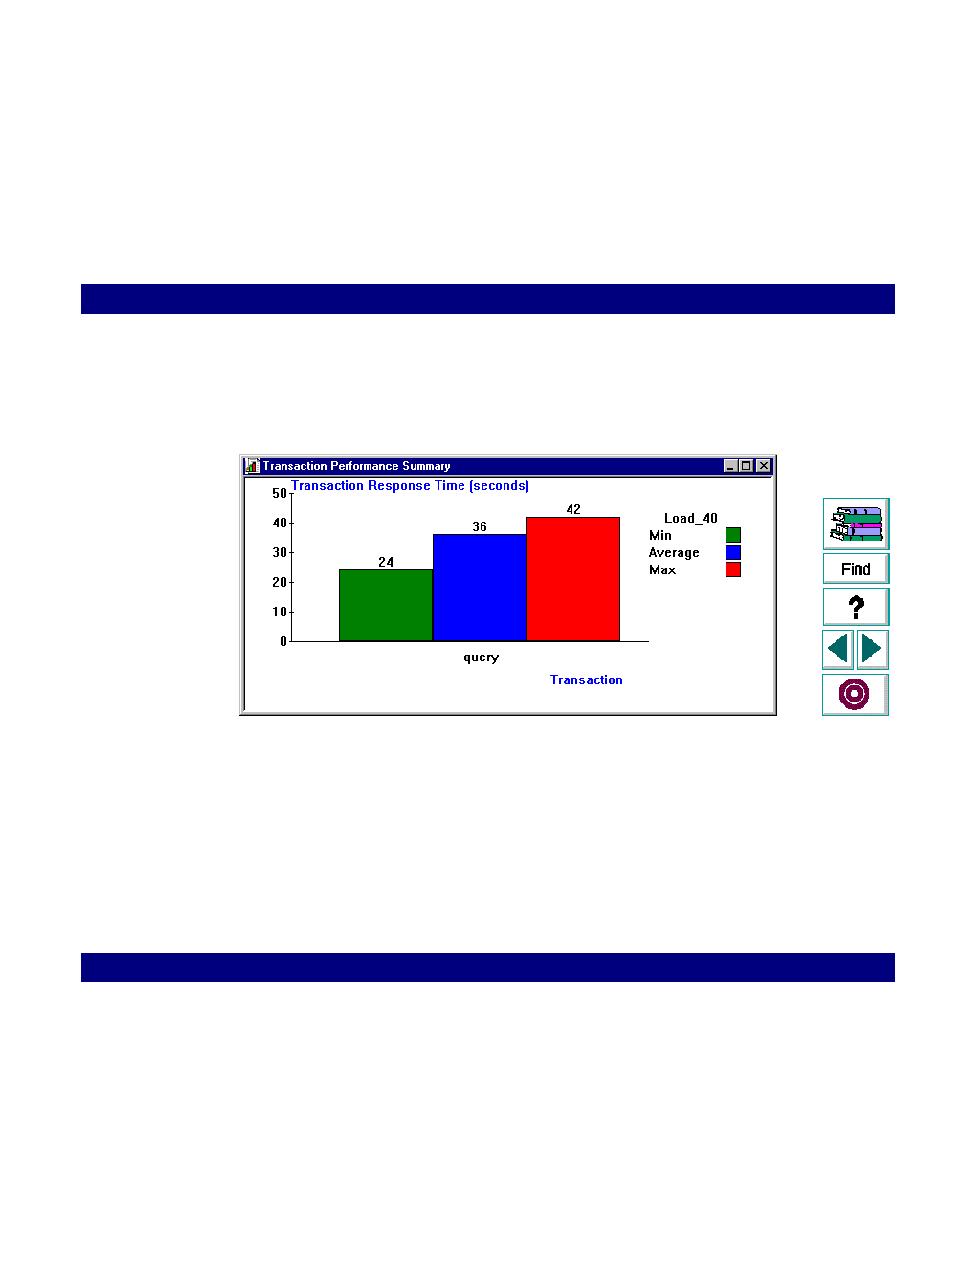
Transaction Performance Summary Graph and Report
The Transaction Performance Summary graph displays the minimum, maximum
and average performance time for all the transactions in the scenario.
The
x-axis
specifies the name of the transaction. The
y-axis
shows the time,
rounded off to the nearest second, taken to perform each transaction.
For example, the above graph displays the statistics of the query transaction. The
transaction was performed in a minimum time of 24 seconds, an average time of 36
seconds, and a maximum time of 42 seconds.