Resource Utilizations
testing metric, there are still important points to consider.
·
skew your results.
average and a 90
collected response times for abandoned pages may not represent the same activity as
non-abandoned pages. To be safe, report response times for non-abandoned pages
with an end-user response time graph and response times and abandonment
percentages by page on a separate graph or table.
to represent an equivalence class, there could be differences that you are unaware of.
testing. Most frequently, resource utilization metrics are reported verbally or in a
narrative fashion. For example, "The CPU utilization of the application server never
exceeded 45 percent. The target is to stay below 70 percent." It is generally valuable to
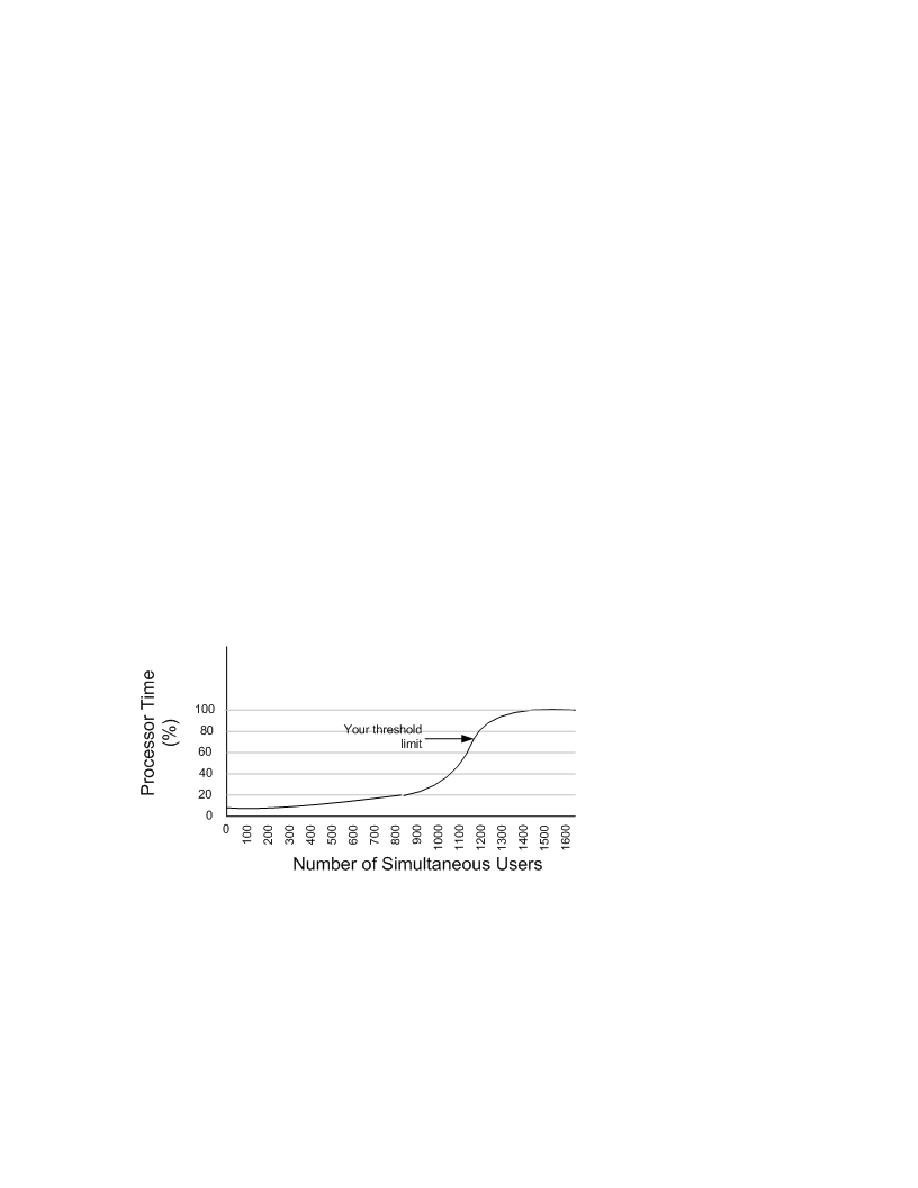
report resource utilizations graphically when there is an issue to be communicated.
Figure 16.3 Processor Time