TUXEDO emulation commands
Types of Reports
367
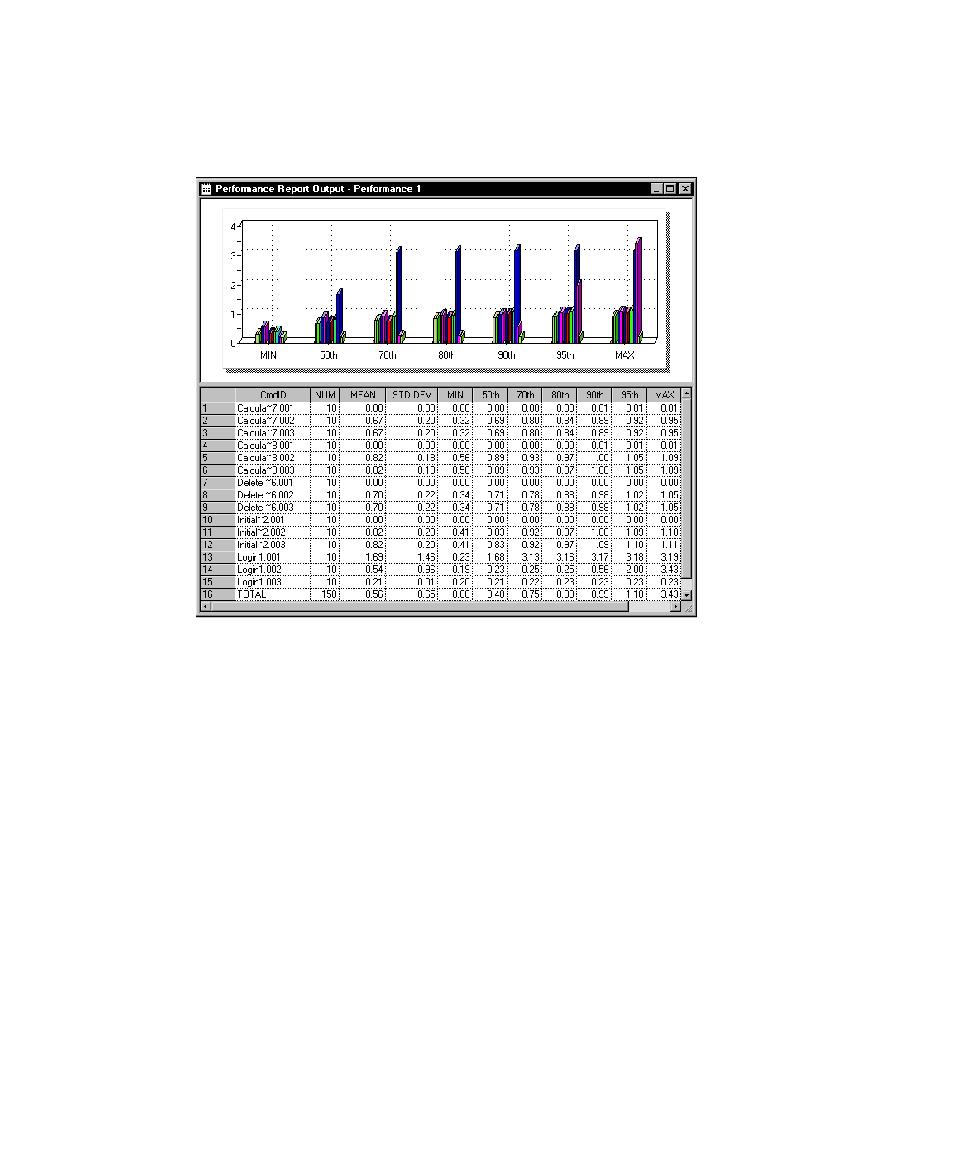
The following figure shows an example of a Performance report. The graph plots the
seconds of response times against preset percentiles. Thus, this graph shows 15 bars
for each percentile category because a total of 15 commands are graphed.
What's in Performance Reports?
Performance reports contain the following information:
s
Cmd ID
The command ID associated with the response.
s
NUM
The number of responses for each command ID (the number of times each
command ID appeared in the test log). In this example, each command ID has 10
responses.
s
MEAN
The arithmetic mean of the response times of all commands and responses
for each command ID.
s
STD DEV
The standard deviation of the response times of all commands and
responses for each command ID.
s
MIN
The minimum response time for each command ID. In this example, the
minimum response times range from 0.00 second, which means that the command
took less than a hundredth of a second to complete, to 1.69 seconds.