reporting performance-related results in TestManager
368
Chapter 12 - Reporting Performance Testing Results
s
50th
,
70th
,
80th
,
90th
,
95th
The percentiles of the response times for each
command ID.
The percentiles compare the response times of each command ID. For example, the
50th column shows the 50th percentile of time for each command ID. This means
that half of the commands had a shorter response time and half had a longer
response time.
In this example, the 50th percentile of Calcula~7.002 is .69. This means that 50% of
the response times are less than 0.69 seconds. The 95th percentile of Calcula~7.002
is .92. This means that 95% of the response times are less than 0.92 seconds.
s
MAX
The maximum response time of all responses for each command ID. In this
example, they range from 0.01 second to 3.43 seconds.
The total response time is listed in the table but is not displayed in the graph because,
to a casual onlooker, a graph that includes this total might appear skewed. However,
you can display the total response time. To display the total response time in the
graph:
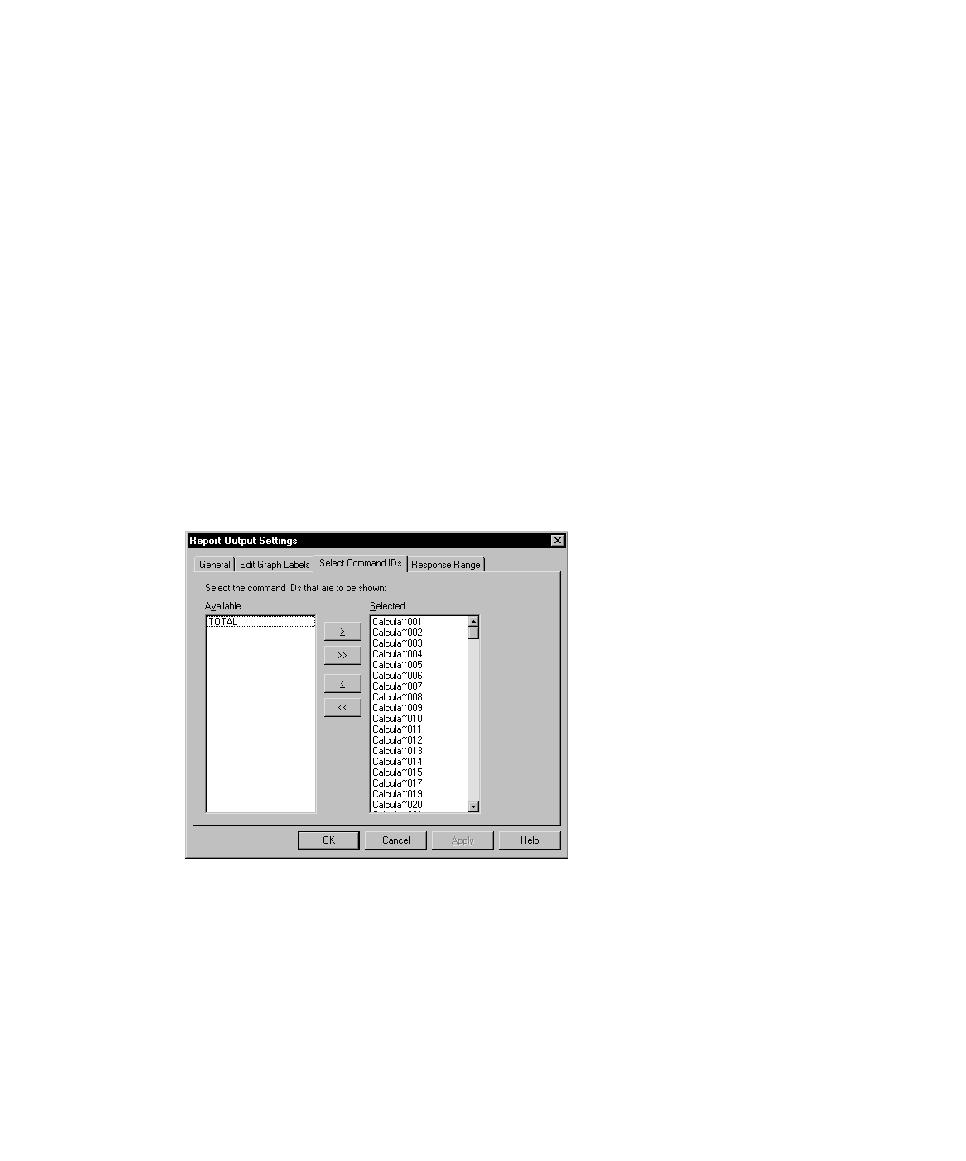
1
From a Performance report, right-click the graph and select
Settings
.
2
Click the
Select Commands IDs
tab, and then select
TOTAL
.