Enlarging and Rotating a Graph
Exporting Report Data
347
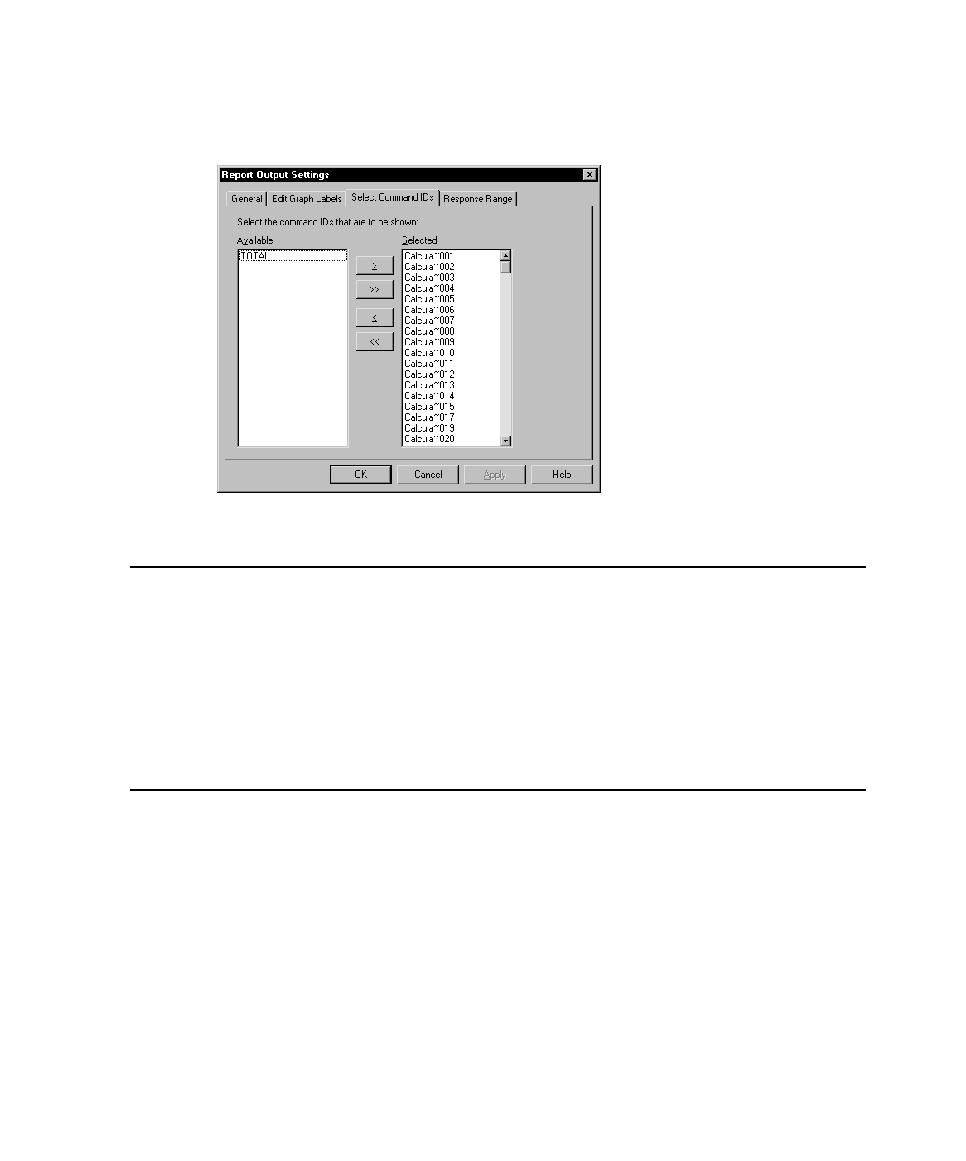
To filter the command IDs in a graph:
s
In the graph in which you want to filter IDs, click
View > Settings
.
Exporting Report Data
The Performance, Command Status, Compare Performance, and Response vs. Time
reports display data graphically. You can export this graphic data to a .
csv
file for
further processing.
To export report data to a .
csv
file:
s
Display the data, and then click
File > Export to File
.
Changing Report Defaults
TestManager automatically generates Performance and Command Status reports at
the end of a suite run. In addition, you can click a report name on the Report bar, and
TestManager runs that report.
You can specify the reports that TestManager generates at the end of a run. For
example, TestManager can automatically display a Command Usage report in
addition to the Performance and Command Status reports. TestManager can also
generate a Performance report based on a report that you have defined instead of the
default Performance report.