Close the graph
TestDirector Tutorial
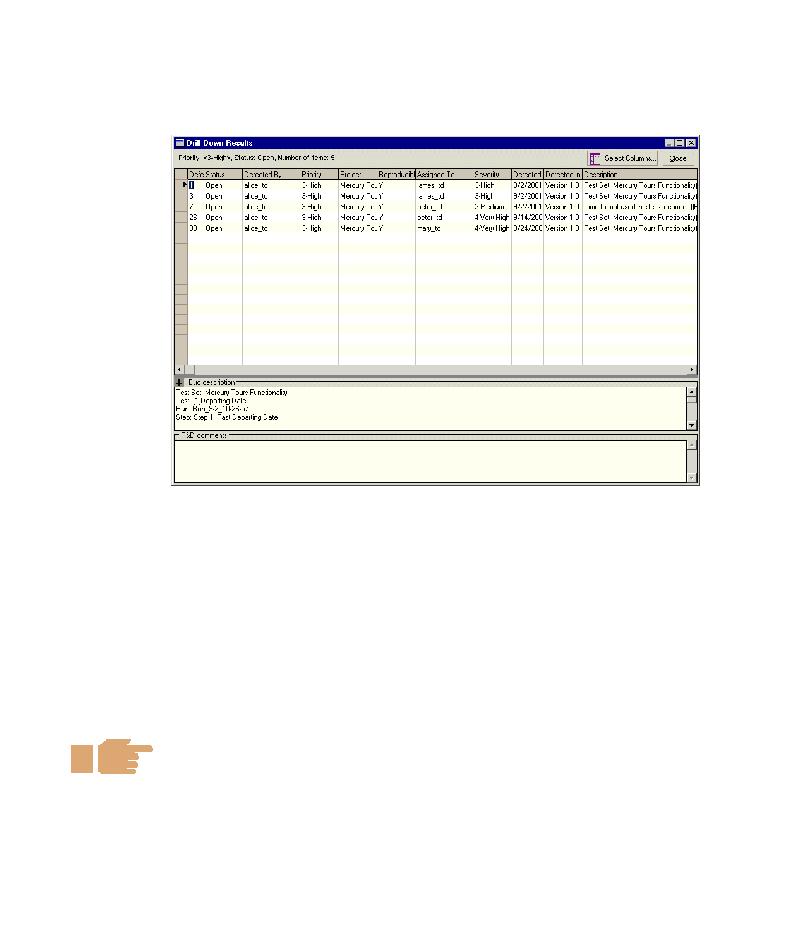
For example, if a bar segment indicates a total of five defects, the Drill Down
Results displays the five defects.
You can modify the information in the grid, and determine the column
appearance and order. For the purpose of this exercise, skip this option.
Click Close to exit the Drill Down Results dialog box.
8 Display other graph views.
Click the Pie Chart tab to display the bar graph as a pie graph.
Click the Data Grid tab to display the pie graph as a grid.
9 Close the graph.
Click the Back button. The Defects module is displayed.
Now that you are familiar with generating reports and graphs, you can
proceed to Lesson 7, "Where Do You Go from Here?". In Lesson 7, you will
apply the TestDirector concepts and skills you learned to your own
application.
104