Debugger - Viewing the call stack
178
User's Guide
7 U
SING
THE
D
EBUGGER
Viewing the call stack
Viewing the call stack
The call stack is a description of all the function calls that are currently active
in the script you are debugging. By viewing the call stack, you can trace the
flow of execution, possibly uncovering errors that result when a script's flow
of control is not what you intended.
Procedure To view the current call stack, select View/Call Stack
The call stack is shown in a new window.
Tip To return to the script being debugged, press F6 or select View/
Module and select the script from the displayed list.
Viewing other script elements
In addition to information about the breakpoints, output, and call stack,
SilkTest also gives you access to information about a running script's
variables and modules.
Viewing and setting variables
Viewing variables
When debugging, you can examine variables.
Procedure To view a list of all the local variables that are in scope
(accessible) from the current line, including their values, select View Local
Variables.
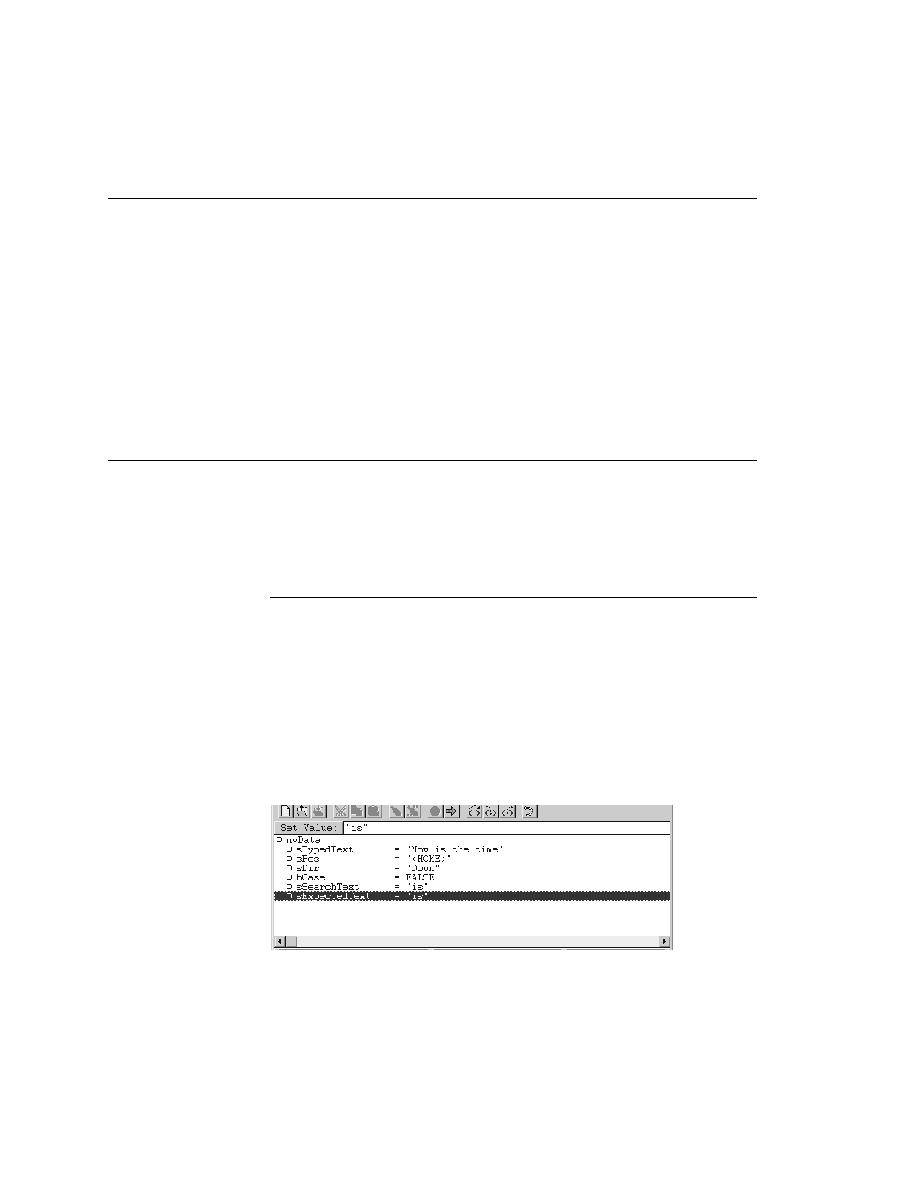
Procedure To view a list of global variables, select View/Global Variables.
The variables and their values are listed in a new window.