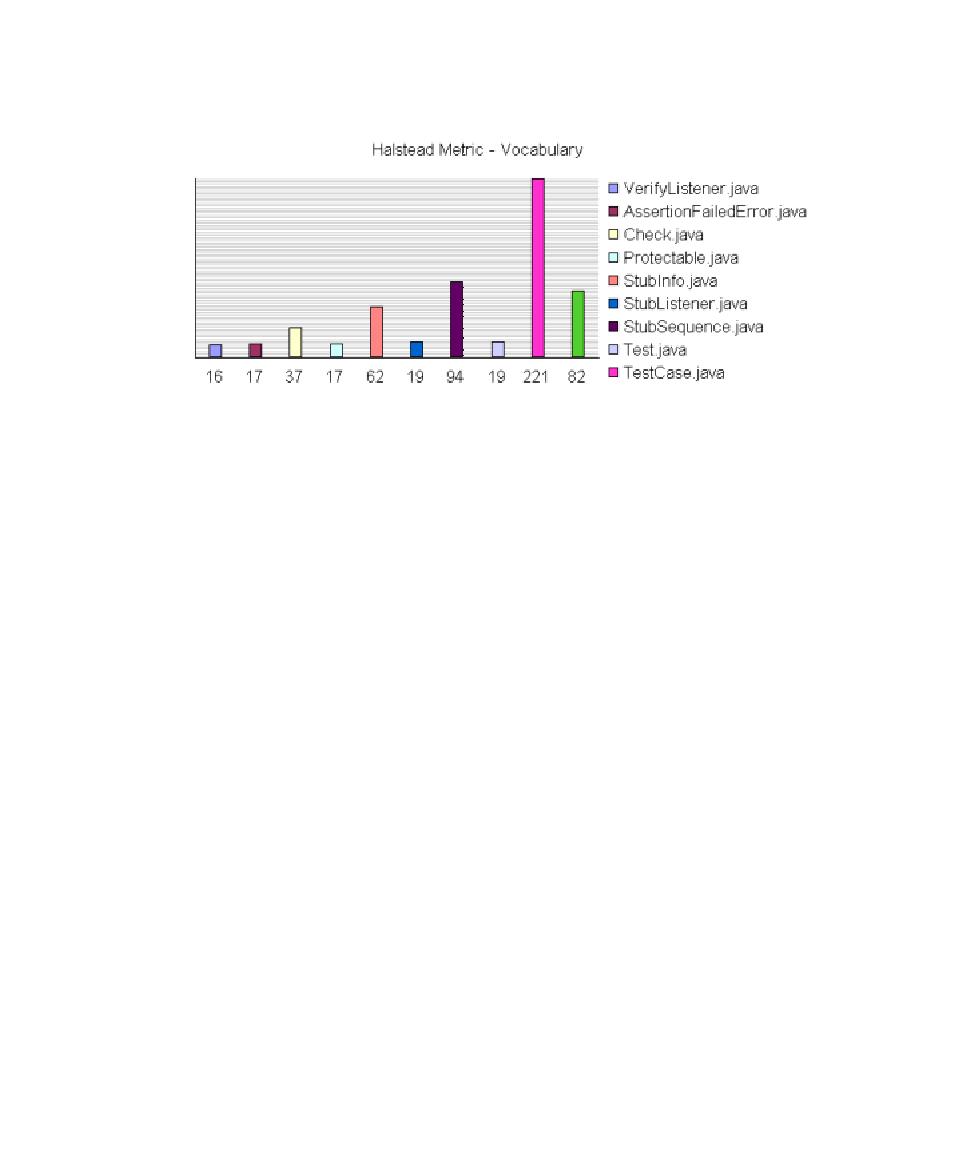
Halstead Graph
Test RealTime - User Guide
Halstead Graph
The following display modes are available for the Halstead graph:
·
VocabularySize
·
Volume
·
Difficulty
·
Testing Effort
·
Testing Errors
·
Testing Time
See the Halstead Metrics section for more information.
Metrics Summary
The scope of the metrics report depends on the selection made in the Report Explorer
window. This can be a file, one or several classes or any other set of source code
components.
Below the Halstead graph, the Root page displays a metrics summary table, which
lists for for the source code component of the selected scope:
·
V(g): provides a complexity estimate of the source code component
·
Statements: shows the number of statements within the component
·
Nested Levels: shows the highest nesting level reached in the component
·
Ext Comp Calls: measures the number of calls to methods defined outside of the
component class (C++ and Java only)
·
Ext Var Use: measures the number of uses of attributes defined outside of the
component class (C++ and Java only)
62

