Filter the scenarios
Analyzing Test Results · Cross-Scenario Analysis
LoadRunner Controller User's Guide (Windows)
Chapter 16, page 270
In
8
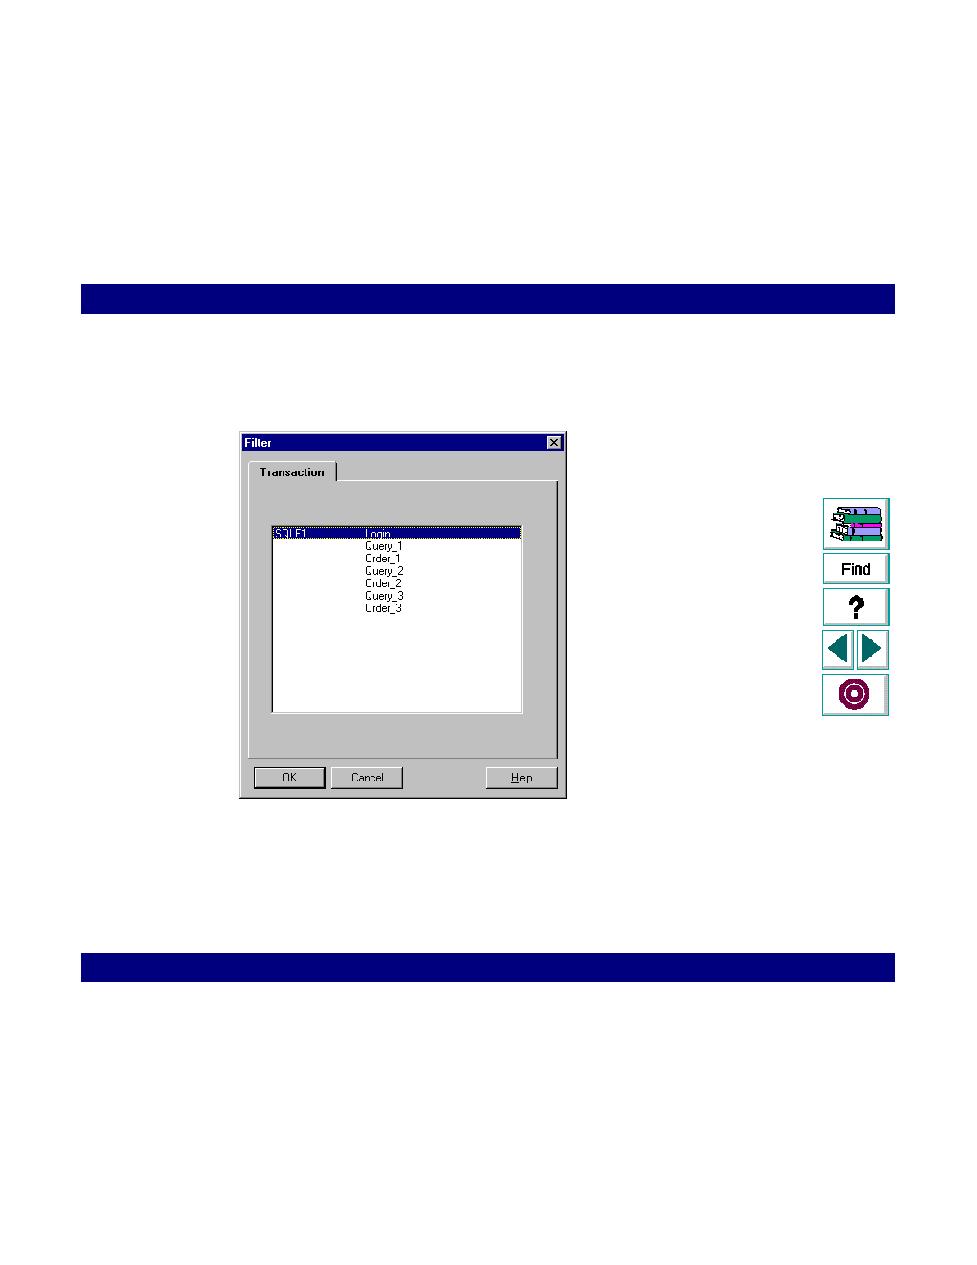
Filter the scenarios and transactions you want to view. Choose multiple
transactions using the
CTRL
key.
9
Manipulate the graphs using the analysis tools. For example, you can tile graphs
to compare their results, change the granularity, and zoom in on a specific area.