Generating Cross-Scenario Analysis Graphs
Analyzing Test Results · Cross-Scenario Analysis
LoadRunner Controller User's Guide (Windows)
Chapter 16, page 268
In
Generating Cross-Scenario Analysis Graphs
You can perform cross-scenario analysis for two or more graphs.
To perform cross-scenario analysis:
1
Select Results > Analyze Results, or click the Analysis button to open the Analysis
window.
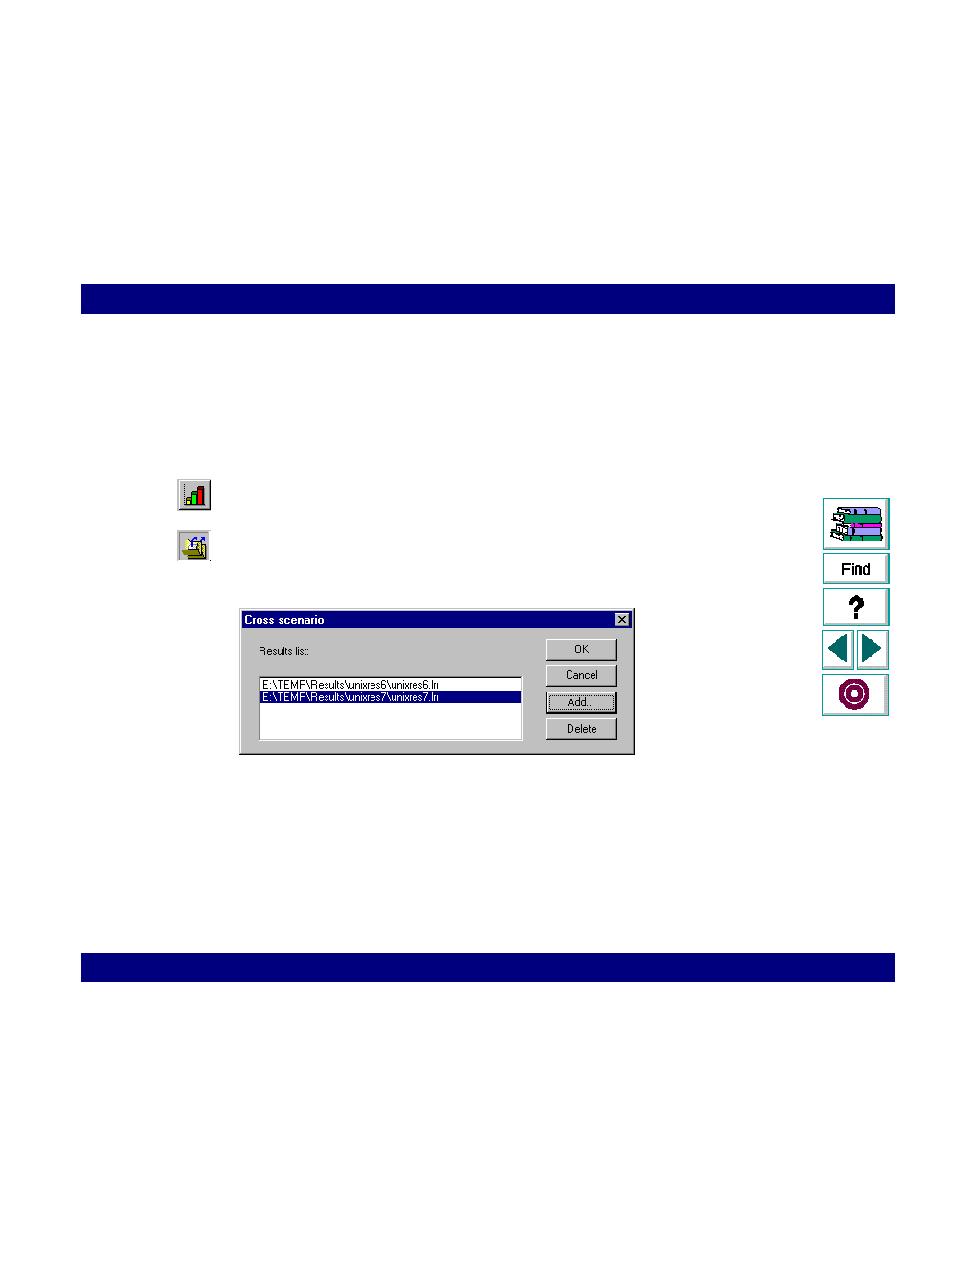
2
Select File > Cross Scenario Graphs, or click the Cross-Scenario button. The
Cross Scenario dialog box opens. You use the dialog box to select the scenarios
to compare.
3
Click Add to add scenarios to the Results list. The Open dialog box opens.
4
In the Open dialog box, select a results directory and choose a results file (
.lrr
).
Click OK. The scenario is added to the Results list.
5
Repeat steps three and four until all the scenarios you want to compare appear in
the Results list.