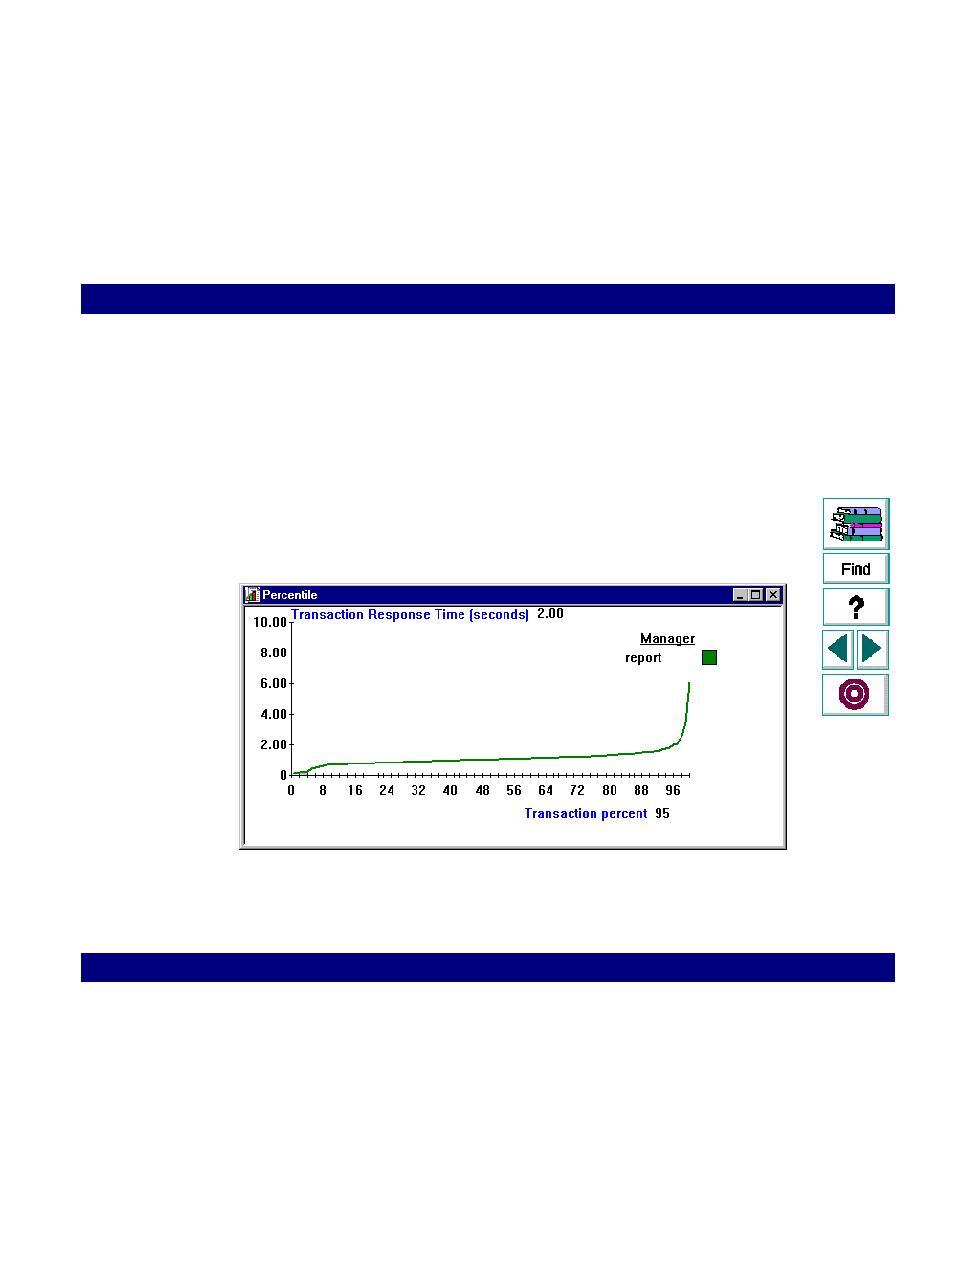
Percentile Graph
performed within a given time range. This graph helps you determine the
percentage of transactions that met the performance criteria defined for your
system. In many instances, you need to determine the percent of transactions
with an acceptable response time. The maximum response time may be
exceptionally long, but if most transactions have acceptable response times, the
overall system is suitable for your needs.