Rendezvous Graph and Report
Analyzing Test Results · Analyzing Scenario Activity
LoadRunner Controller User's Guide (Windows)
Chapter 14, page 233
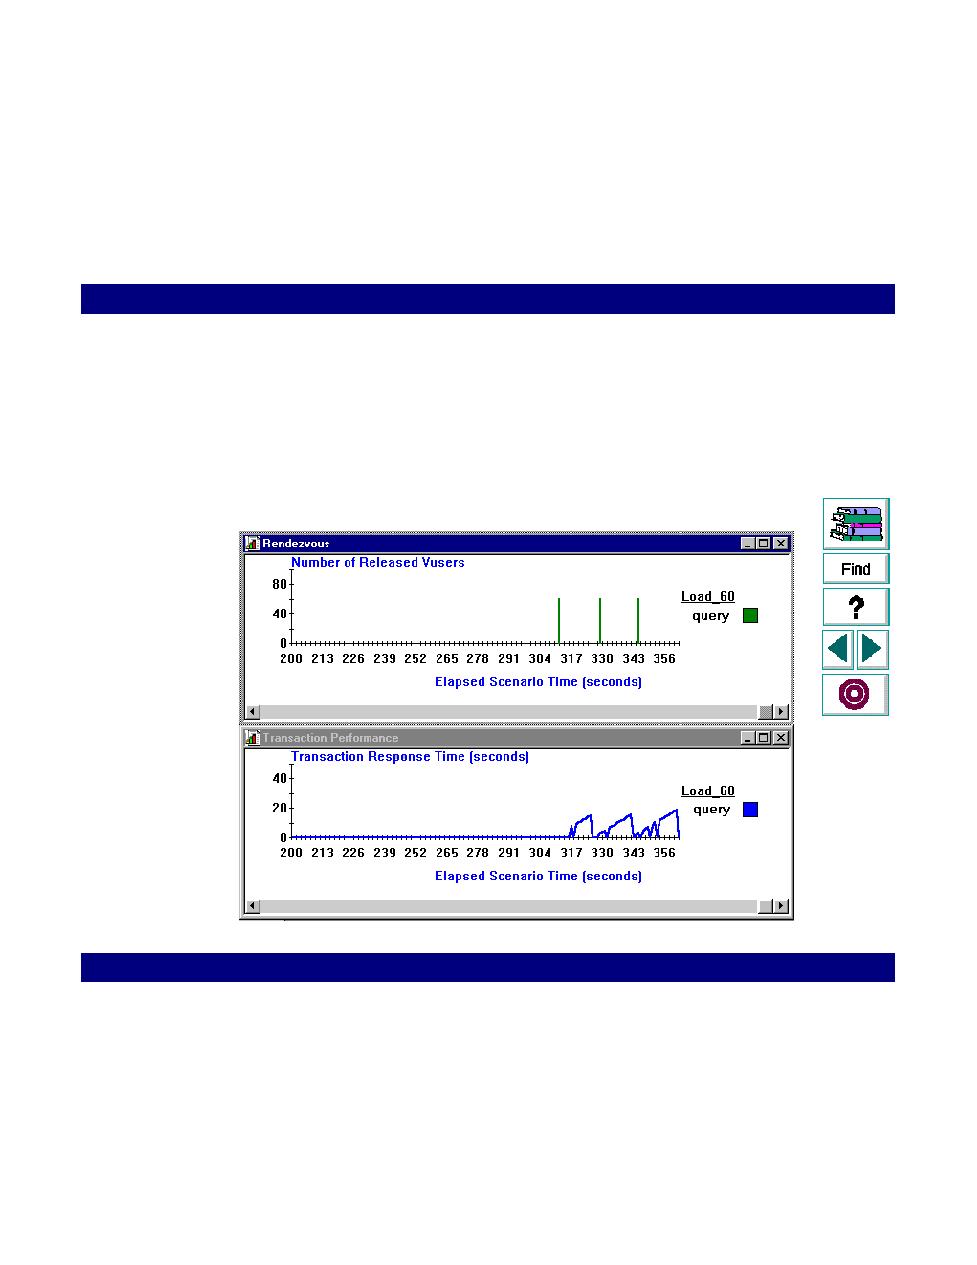
Rendezvous Graph and Report
The Rendezvous graph indicates when Vusers were released from rendezvous
points, and how many Vusers were released at each point.
This graph helps you understand transaction performance times. If you compare
the Rendezvous graph to the Transaction Performance graph, you can see how the
load peak created by a rendezvous influences transaction times.