Running Virtual Users Graph
Analyzing Test Results · Analyzing Scenario Activity
LoadRunner Controller User's Guide (Windows)
Chapter 14, page 232
In
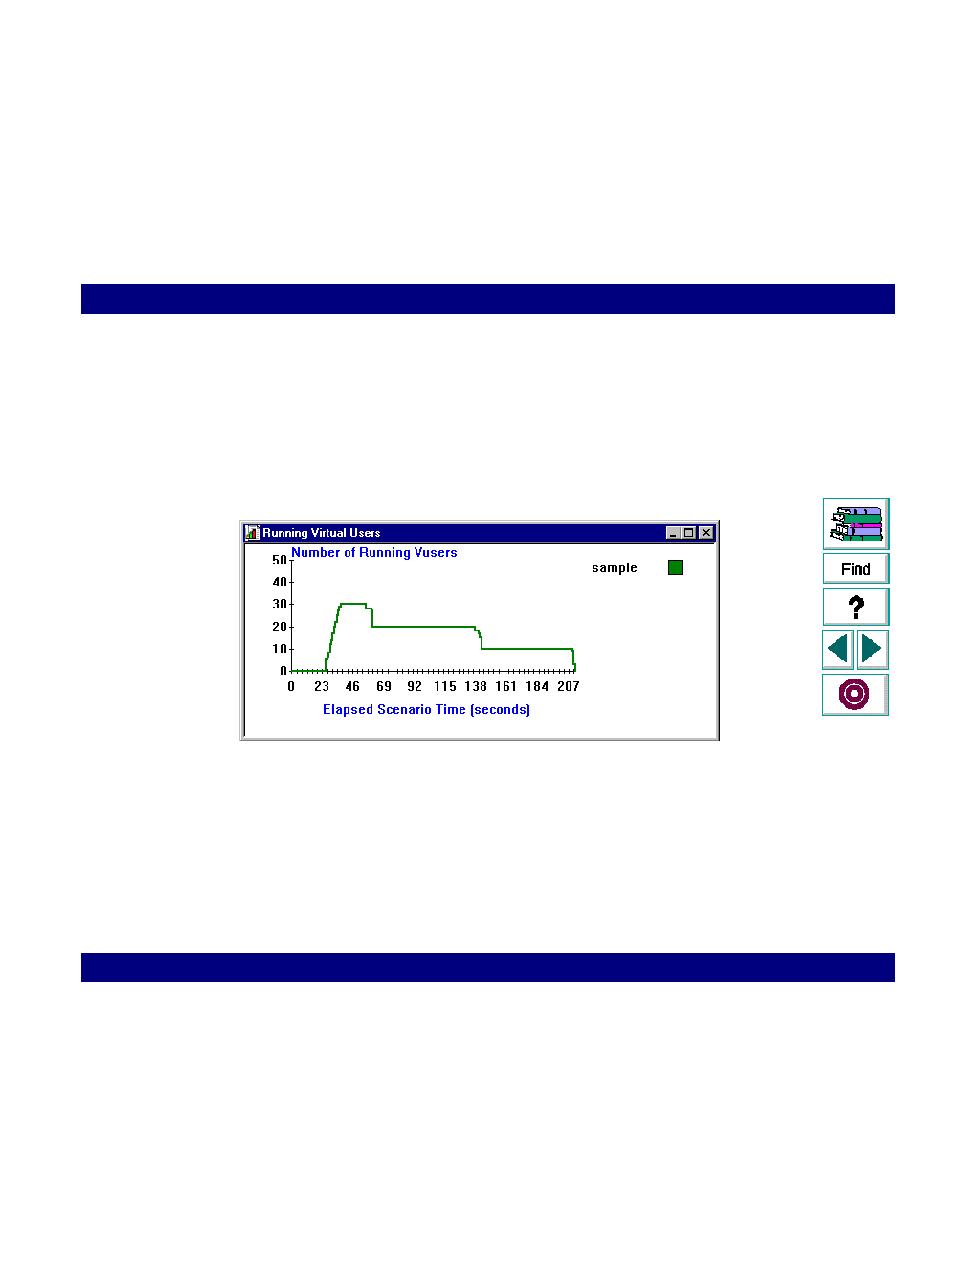
Running Virtual Users Graph
The Running Virtual User graph displays the number of Vusers that executed
Vuser scripts during each second of a scenario run. Only Vusers in the
RUNNING
and
RENDEZ
states are included in the graph. Vusers in the
LOADING
,
READY
and
PAUSE
states are not displayed.
This graph is useful for determining the Vuser load on your server at any given
moment. The
x-axis
represents the elapsed time (in seconds) since the start of the
scenario run. The
y-axis
represents the number of running Vusers in the scenario.
For example, the above graph indicates that there was a maximum load of thirty
Vusers. Until the 37th second of the scenario run, Vusers were gradually loading.
Thereafter, the number of running Vusers decreased to twenty, and then to ten.