To select transactions and Vusers to display
Analyzing Test Results · Understanding LoadRunner Analysis
LoadRunner Controller User's Guide (Windows)
Chapter 13, page 213
To select transactions and Vusers to display:
1
Select Results > Analyze Results, or click the Analysis button. The LoadRunner
Analysis window opens, and the Running Vusers graph is displayed.
2
Select a graph from the Graphs menu. The graph is displayed. You can display
multiple copies of the same graph.
3
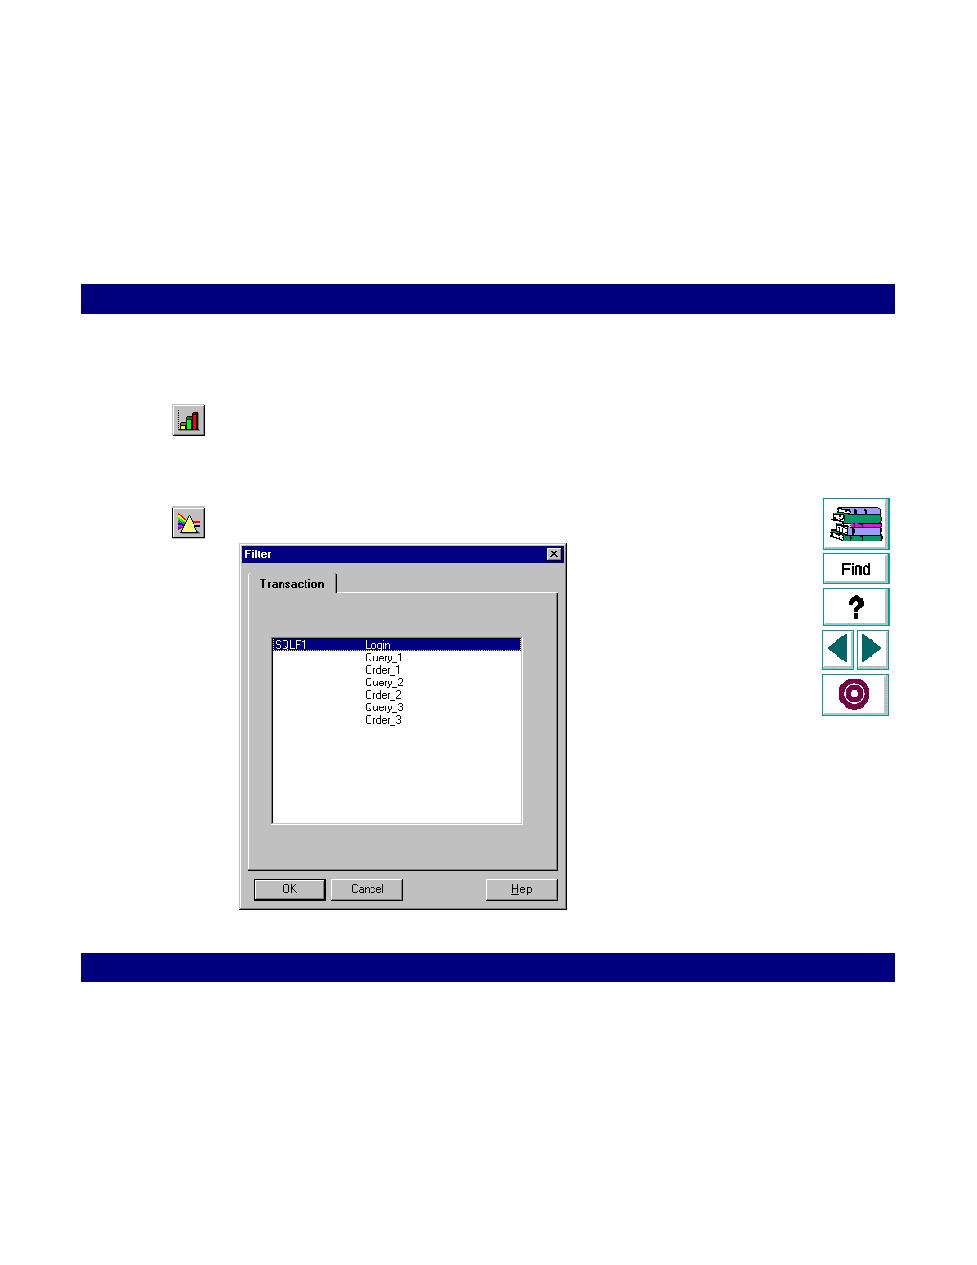
Select View > Filter, or click the Graphic Filters button.