Performance Graphs and Reports
Analyzing Test Results · Understanding LoadRunner Analysis
LoadRunner Controller User's Guide (Windows)
Chapter 13, page 209
Performance Graphs and Reports
* The report is titled Detailed Transactions
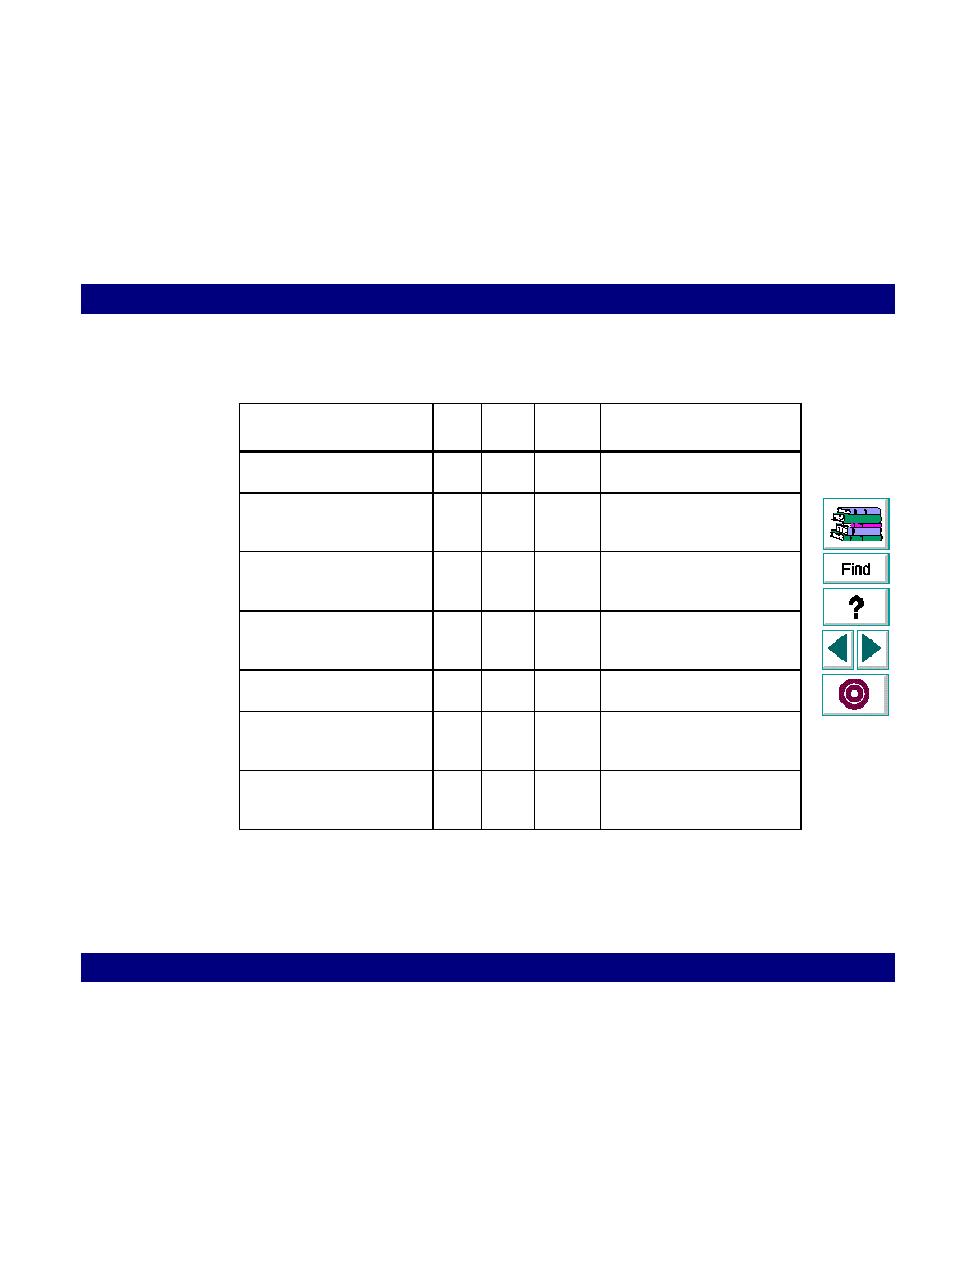
Name
Graph Report
Cross
Scenario
Description
Data Point
The performance of an
external utility
Percentile
The percentage of
transactions performed within
a given time range
Performance Under Load
The transaction response
time according to the number
of running Vusers
Transaction Performance
The transaction response
time as a function of the
elapsed scenario time
Transaction Performance
Summary
The minimum, maximum, and
average transaction time
Transaction Performance
Summary by Vuser
The minimum, maximum, and
average transaction times for
each Vuser
Transaction Distribution
The distribution of the time
taken to perform a
transaction.