LoadRunner cross-scenario
Analyzing Test Results · Understanding LoadRunner Analysis
LoadRunner Controller User's Guide (Windows)
Chapter 13, page 208
In
LoadRunner cross-scenario analysis lets you compare the graphs from several
scenarios. This feature is useful for benchmarking hardware in determining how a
superior system will improve performance. For more information, see Chapter 16,
Cross-Scenario Analysis
.
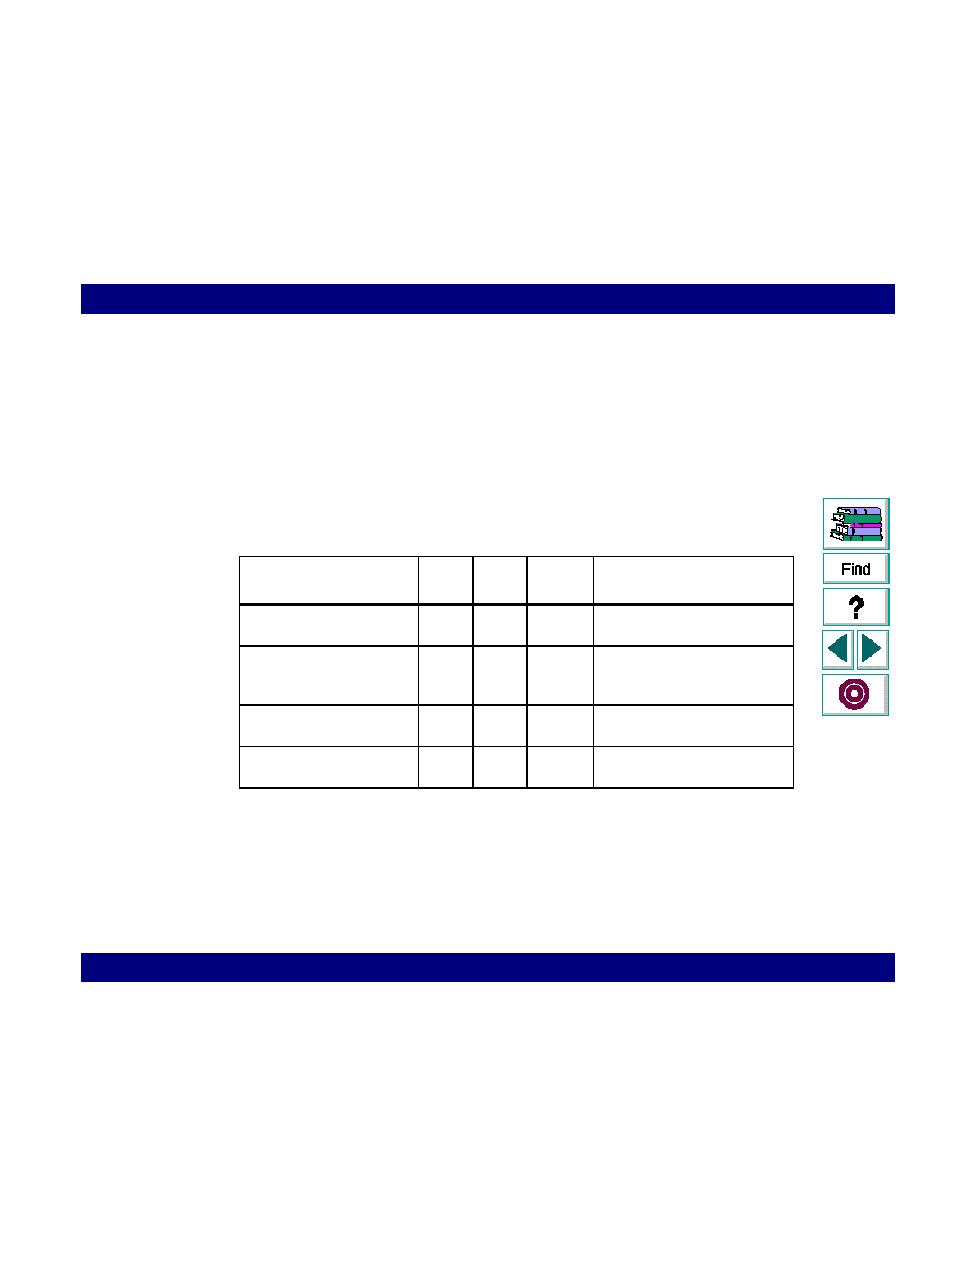
The following tables shows the information provided by the graphs and reports:
Activity Graphs and Reports
Name
Graph Report
Cross
Scenario
Description
Running Vusers
The number of Running
Vusers at a given moment
Rendezvous
Rendezvous information: The
number of arrived members,
etc.
Transactions per Second
The number of transactions
executed per second
Scenario Execution
Detailed scenario information
for each Vuser