Software Defect Reports
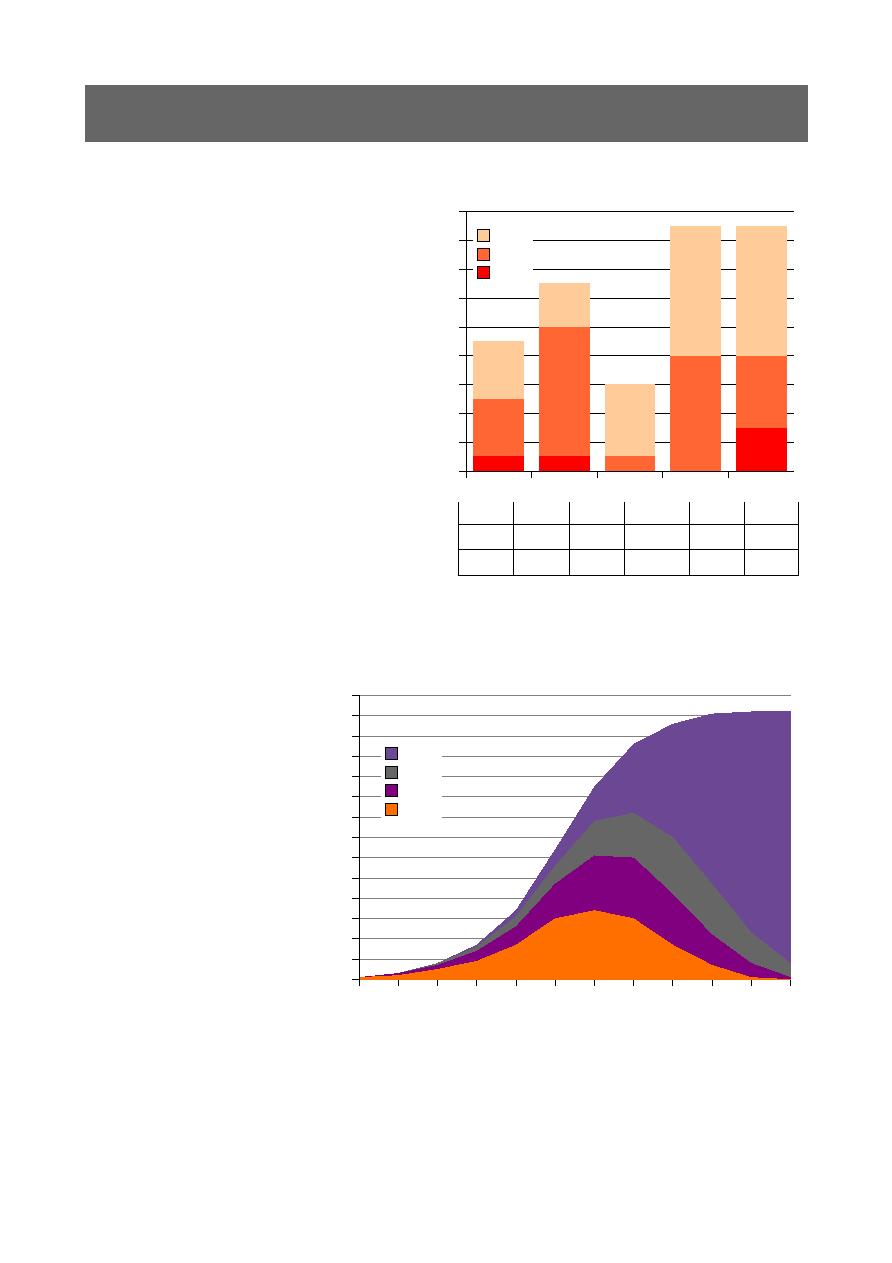
number of defects by status and severity.
Something like the diagram to the right.
status in testing. As the project progresses you
would expect to see the columns marching
across the graph from left to right moving
from New to Open to Fixed to Closed.
course possible. For example you might want
to have a report on defect ageing how long
have defects been at a certain status. This
allows you to target defects which have not
progressed, which have not changed status over a
period of time. By looking at the average age of
defects in each status you can predict how long a
given number of defects will take to fix.
number of defects by status over time (see below).
graph is that it allows you to
predict the future.
September and plot a line down
the curve of the 'fixed' defects
it cuts the x-axis after the end
of December. That means that
from as early as September, it
was possible to predict that not
all of the defects would be fixed
by December, and the project
would not finish on time.
of the 'new' defects you can
intuit something about the
progress of your project.
staying fixed. Either the developers are reintroducing bugs when they attempt to fix them, your
code control is poor or there is some other fundamental issue.
Fixed
Open
New
Major
Critical