Contents of a technical report
time, remember that sometimes creativity is needed to make your message clear and
intuitive.
Consider including the following key components when preparing a technical report:
·
A results graph
·
A table for single-instance measurements (e.g., maximum throughput achieved)
·
Workload model (graphic)
·
Test environment (annotated graphic)
·
Short statements of observations, concerns, questions, and requests for collaboration
·
References section
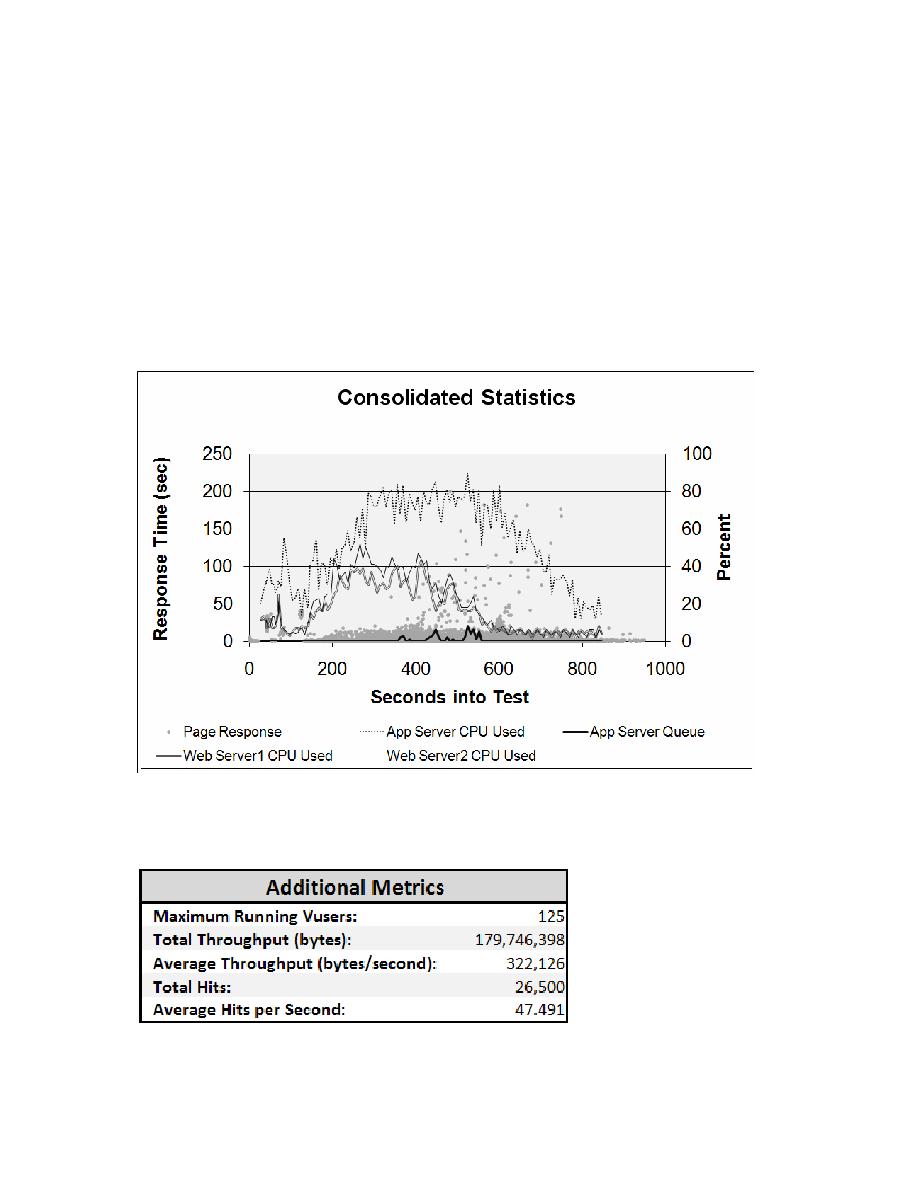
Exemplar Results Graph
Figure 16.8 Consolidated Statistics
Exemplar Tables for Single-Instance Measurements
Figure 16.9 Single Instance Measurements