Statistical equivalence
4.
is noticeably higher or lower, but the results for the data sets of the remaining items
appear similar, the test itself is probably statistically similar (even though it is
probably worth the time to investigate the reasons for the difference of the one
dissimilar data set.
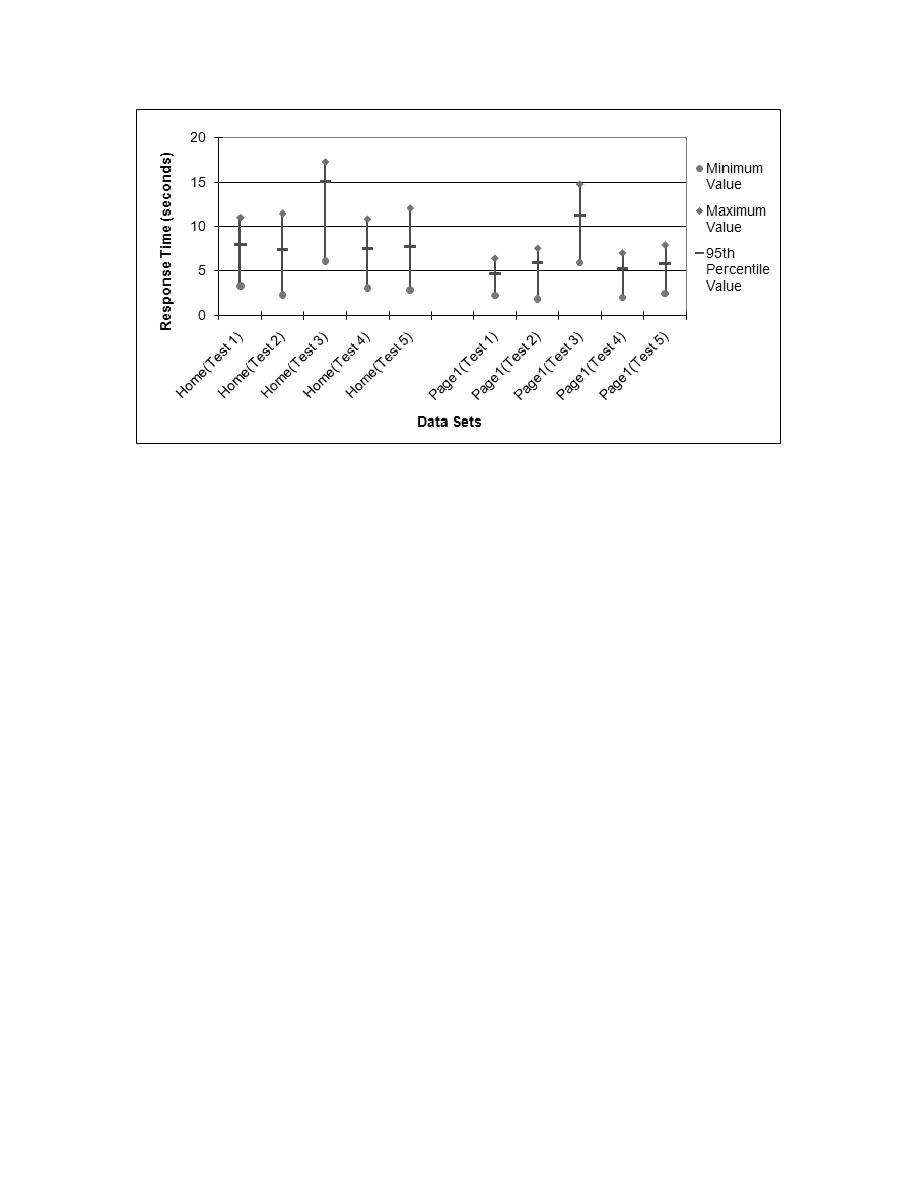
principle of statistical equivalence. Essentially, the process outlined above for
determining statistical significance could be restated as "Given results data from multiple
tests intended to be equivalent, the data from any one of those tests may be treated as
statistically significant if that data is statistically equivalent to 80 percent or more of all
the tests intended to be equivalent." Mathematical determination of equivalence using
such formal methods as chi-squared and t-tests are not common on commercial software
development projects. Rather, it is generally deemed acceptable to estimate equivalence
by using charts similar to those used to determine statistical significance.
standard deviations, or 99 percent, of all collected measurements is considered an outlier.
The problem with this definition is that it assumes that the collected measurements are
both statistically significant and distributed normally, which is not at all automatic when
evaluating performance test data.
For the purposes of this explanation, a more applicable definition of an outlier from a
StatSoft, Inc. (http://www.statsoftinc.com) is the following: