of the transactions had a better response time
Analyzing Test Results · Cross-Scenario Analysis
LoadRunner Controller User's Guide (Windows)
Chapter 16, page 277
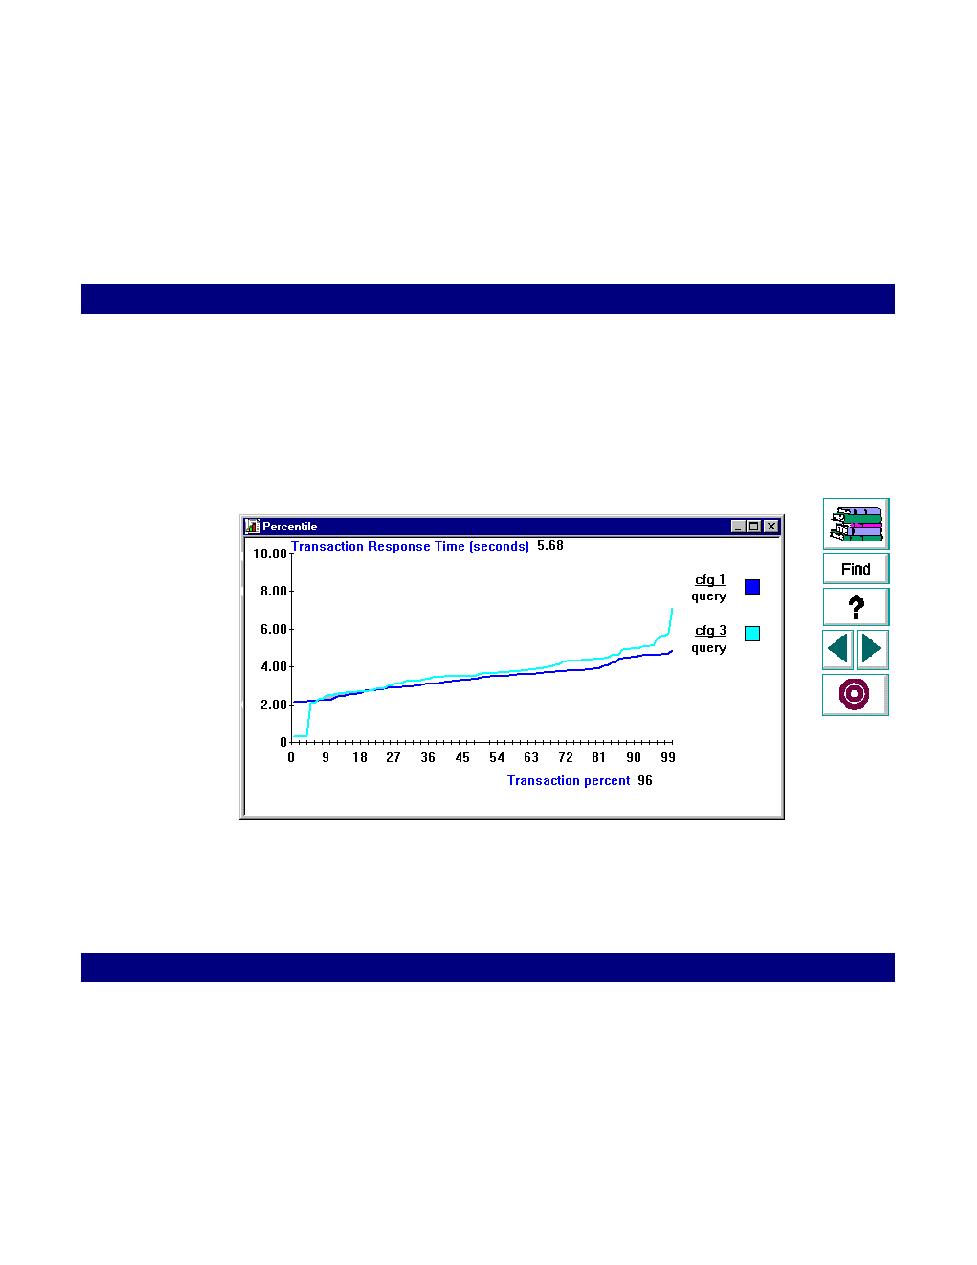
The above graph indicates that a large percentage of the transactions had a better
response time in the third configuration than in the second configuration.
If we filter the graph to display only the first and third configurations, the
y-axis
scale shows that the response time for the first configuration is slightly better
than the third.