Determining Individual User Data
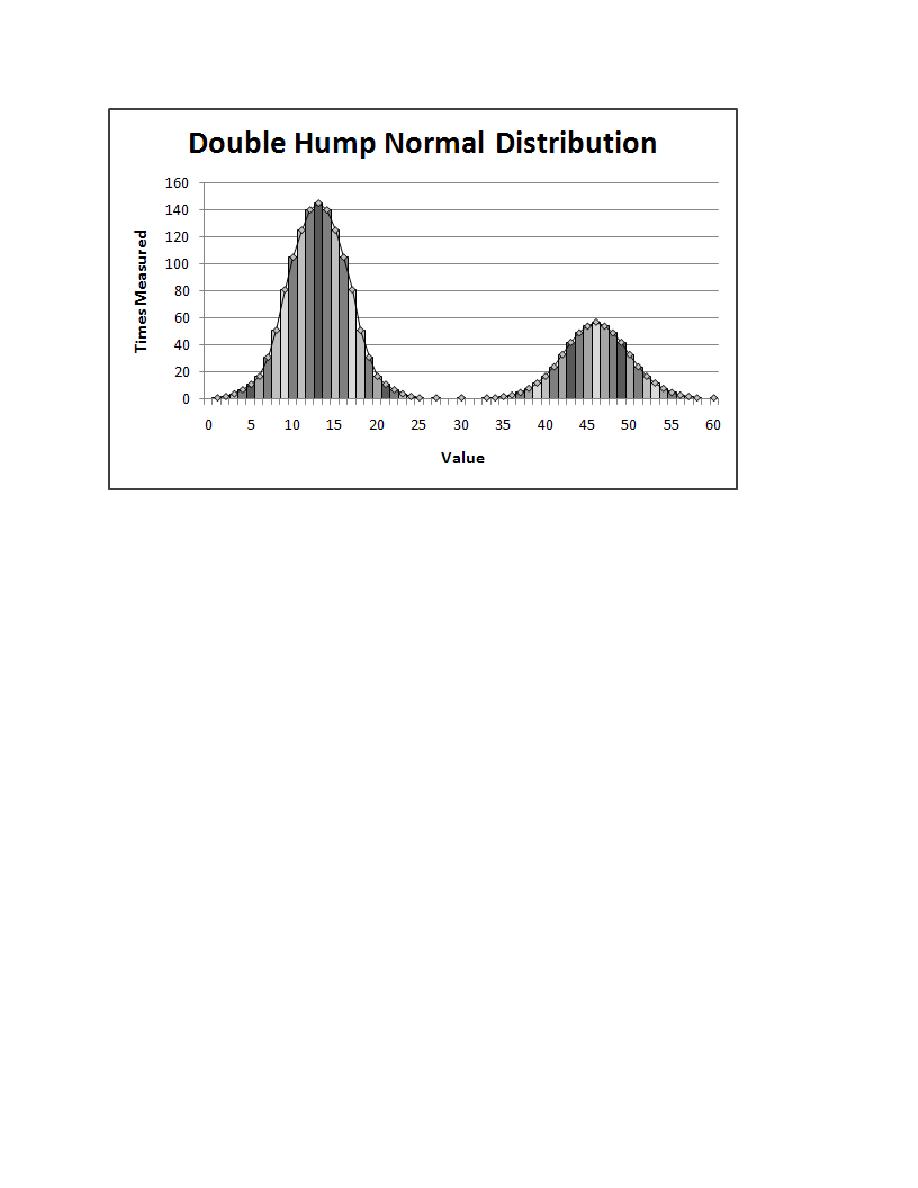
Figure 13.6 Double Hump Normal Distribution
100 to represent a percentage of users. If that number is below a certain threshold (in the graph
above, below 61), call the normal distribution function with the parameters to generate delays
with the first distribution pattern. If that number is at or above that threshold, call the normal
distribution function with the correct parameters to generate the second distribution pattern.
accomplish the tasks or activities related to those scenarios, and the user-specific data associated
with a user accomplishing that task or activity.
Unfortunately, navigation paths alone do not provide all of the information required to
implement a workload simulation. To fully implement the workload model, you need several
more pieces of information. This information includes:
·
simulated users:
·
enough data to conduct an effective test.