Negative Exponential Distribution
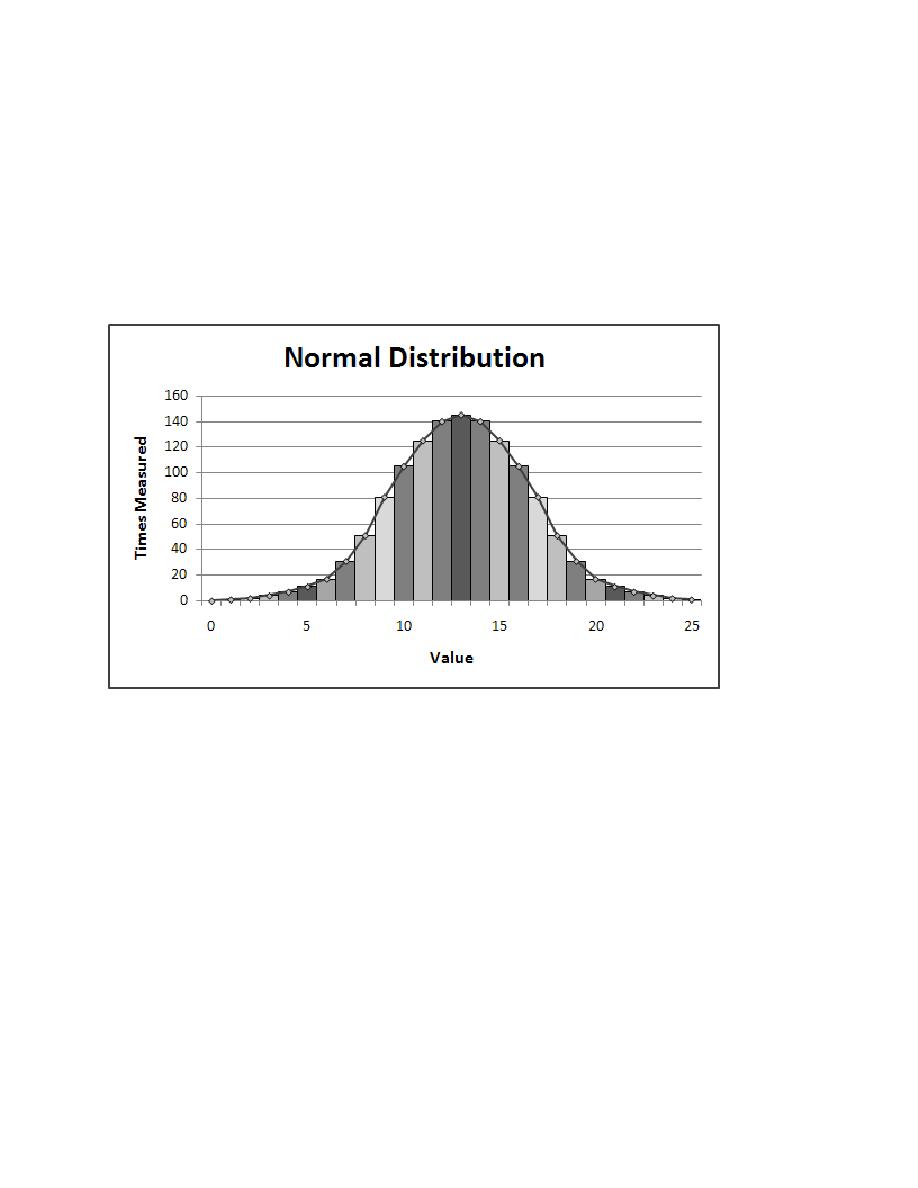
normal distribution of 1000 values generated between 0 and 25 (that is, a mean of 12.5 and a
standard deviation of 3.2). Normal distribution is generally considered to be the most accurate
mathematical model of quantifiable measures of large cross-sections of people when actual data
is unavailable. Use a normal distribution in any situation where you expect the pattern to be
shifted toward the center of the end points. The valid range of values for the standard deviation is
from 0 (equivalent to a static delay of the midpoint between the maximum and minimum values)
and the maximum value minus the minimum value (equivalent to a uniform distribution). If you
have no way to determine the actual standard deviation, a reasonable approximation is 25 percent
of (or .25 times the range) of the delay.
Figure 13.4 Normal Distribution
This model skews the frequency of delay times strongly toward one end of the range. This model
is most useful for situations such as users clicking a "play again" link that only activates after
multimedia content has completed playing. The following figure shows a negative exponential
distribution of 1000 values generated between 0 and 25.