Mapping Computer Resource Usage onto Response Time
344
Chapter 12 - Reporting Performance Testing Results
Changing a Graph's Appearance
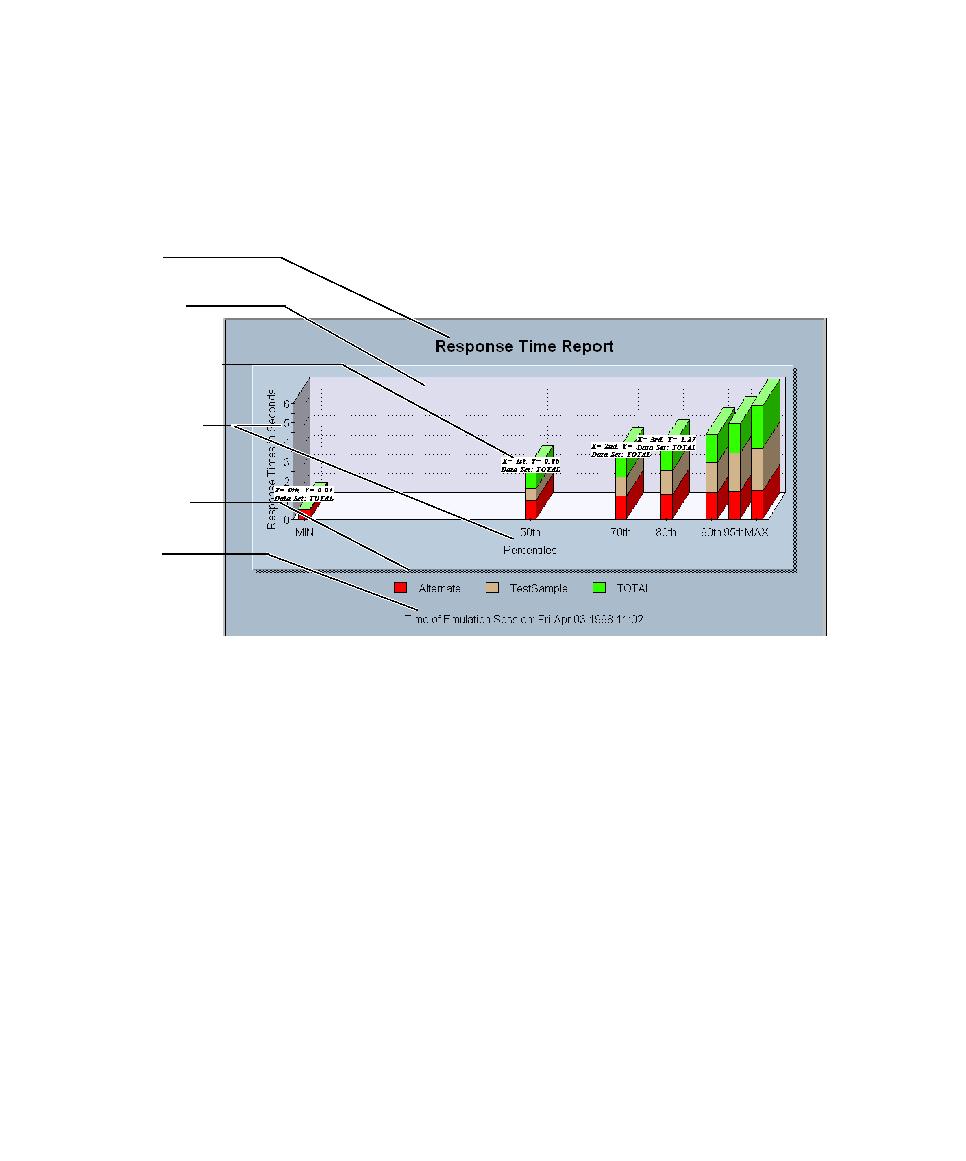
TestManager lets you control a graph's format and appearance. You can display or
clear information about selected points and datasets without affecting the graph's
cumulative data. The following figure shows a stack graph with a header, background
grid, and various other options:
Graph options that you can change include:
s
Log Scale
Scales any graphical display type to its logarithmic equivalent.
s
Inverted Axes
Switches the relative positions of the graph's axes.
s
Show Dataset Label
Applies the data set labels to the graph.
s
Display Legend
Displays a color-coded legend for all displayed graphical
components (not available on the Response vs. Time report).
s
Display Grid
Displays a grid that is useful for visual comparisons (not available
on the Pie graph).
Displaying and Clearing Data Point Information
When working with graphs, you may want to display the value of a specific point in a
graph.
Background
grid
Color-coded
legend
x,y axes labels
Header
Footer
Point