Including Passed and Failed Commands
Customizing Reports
343
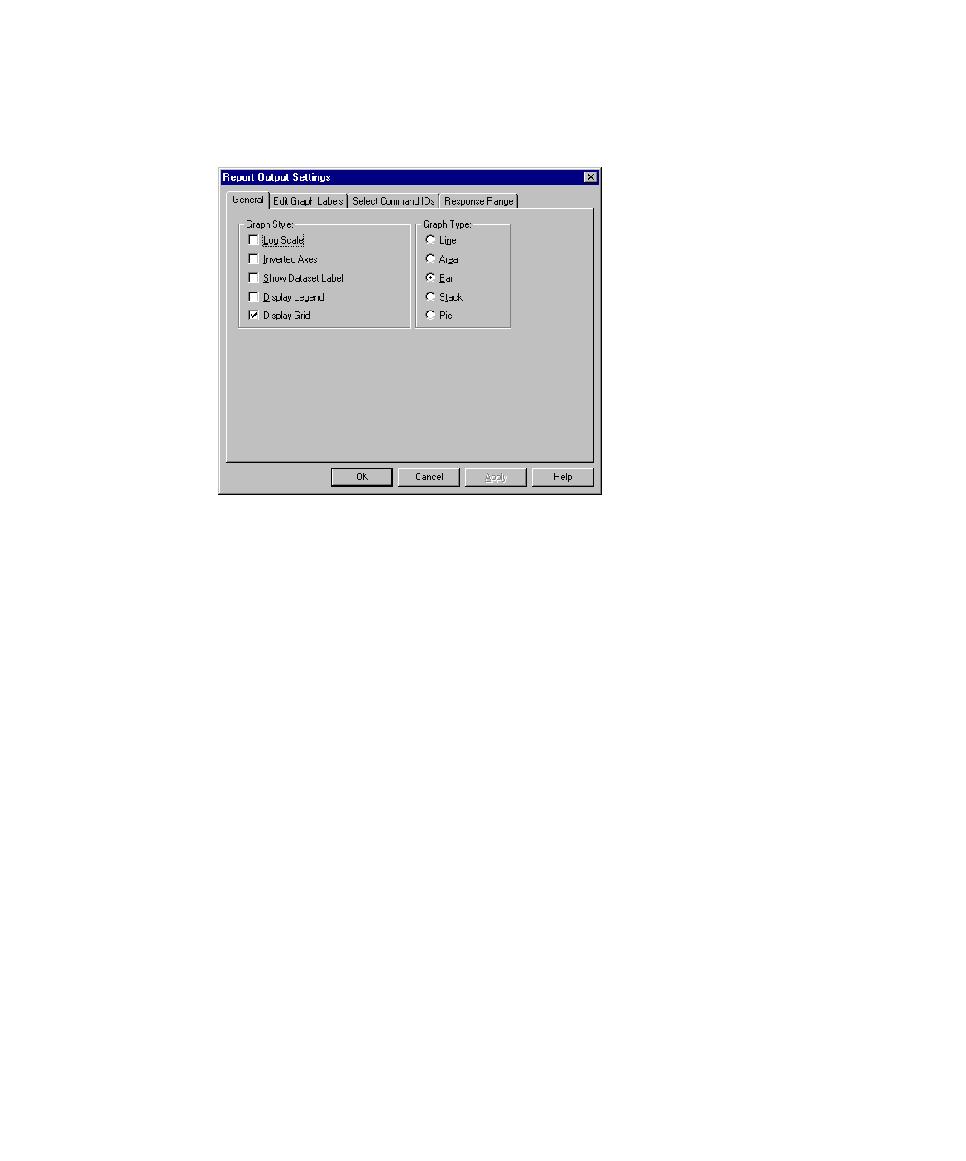
To change the appearance or type of a graph:
s
From an open report, click
View > Settings
.
Note:
The options for changing the appearance or type of a graph vary according to
the type of report that you select.
From this dialog box, you can:
s
Change the appearance of a graph.
s
Change the labels of a graph.
s
Filter information such as the command IDs.
In a Performance report, you can also change the response range that appears in the
graph.