Displaying the Transactor View
Monitoring Test Runs
147
Graphing Resource Usage During a Run
You can graph the resources that your computer uses during a run. This provides you
with a visual representation of resource usage. Within this graph of resources, you can
change the color of an item in the graph, remove an item from the graph, or remove all
items in the graph.
To graph computer resources:
1
During a run, click
Monitor > Computers.
2
Right-click in the
Resources Used
or
Network
columns and then click
Add to Graph
.
Viewing Computers at the Start or End of a Run
The Computer view appears automatically when Agent computers start up. When all
Agents are up and running, the Computer view closes. When Agents begin shutting
down, the Computer view reappears automatically so that you can watch cleanup
activities, such as transferring files to the Local computer.
The Computer view includes
Progress
messages, which indicate when the computer
is creating or initializing processes, transferring files, terminating virtual testers, and
so on.
For information about each column in this view, see Computer view in the TestManager
Help Index.
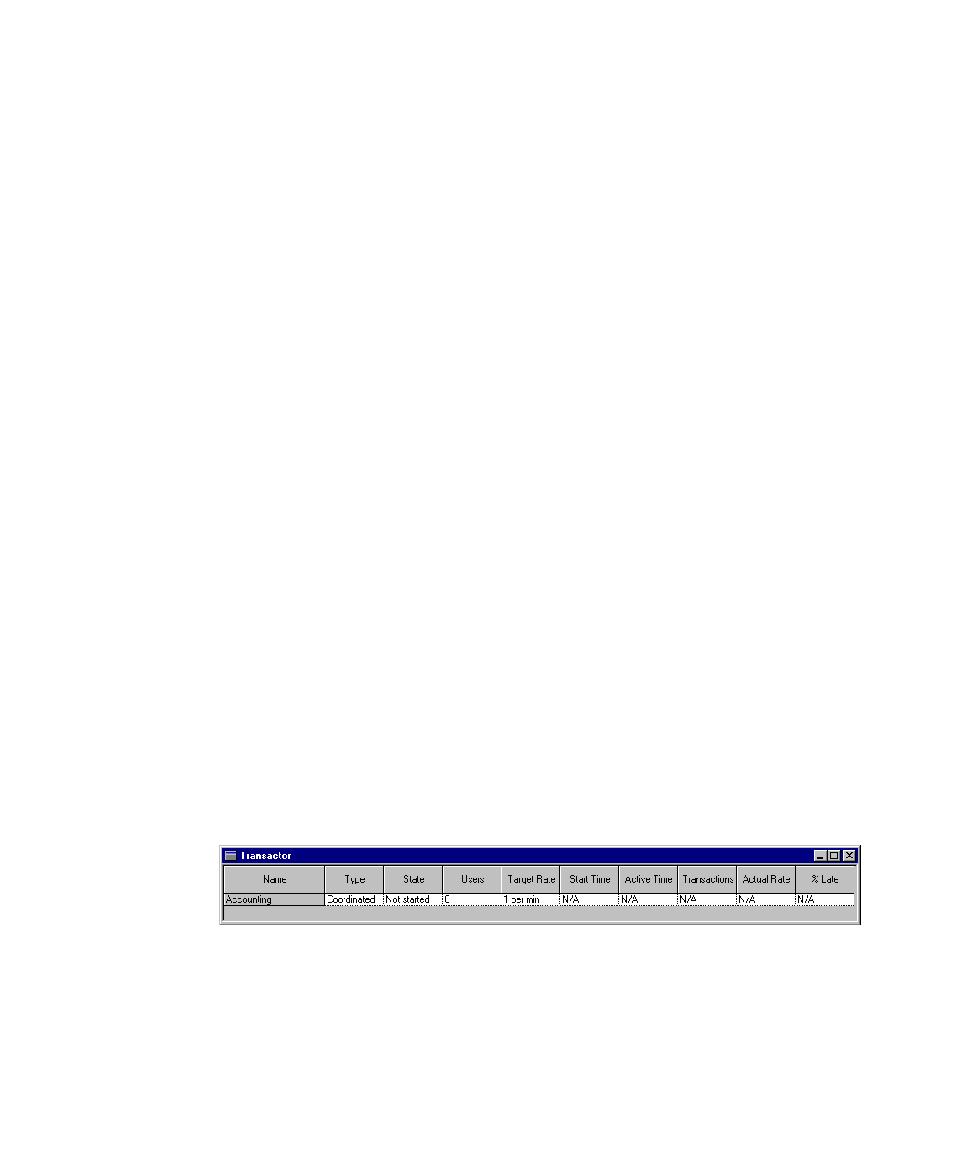
Displaying the Transactor View
The Transactor view shows the status of any transactors that you inserted into the
suite.
Note:
This view pertains primarily to performance testing.
To display a Transactor view:
s
During a suite run, click
Monitor > Transactors
.
For information about each column in this view, see Transactor view in the
TestManager Help Index.