Performance Profiling Results
your grasp. It provides complete, accurate performance data--and provides it in an
understandable and usable format so that you can see exactly where your code is
least efficient. Using Performance Profiling, you can make virtually any program run
faster. And you can measure the results.
Java source code, in real-time, and on both native or embedded target platforms.
Performance Profiling works by instrumenting the C, C++ or Java source code of
your application. After compilation, the instrumented code reports back to Test
RealTime after the execution of the application.
feature, then directs output to the Performance Profiling Viewer, which a
provides a detailed report of memory issues.
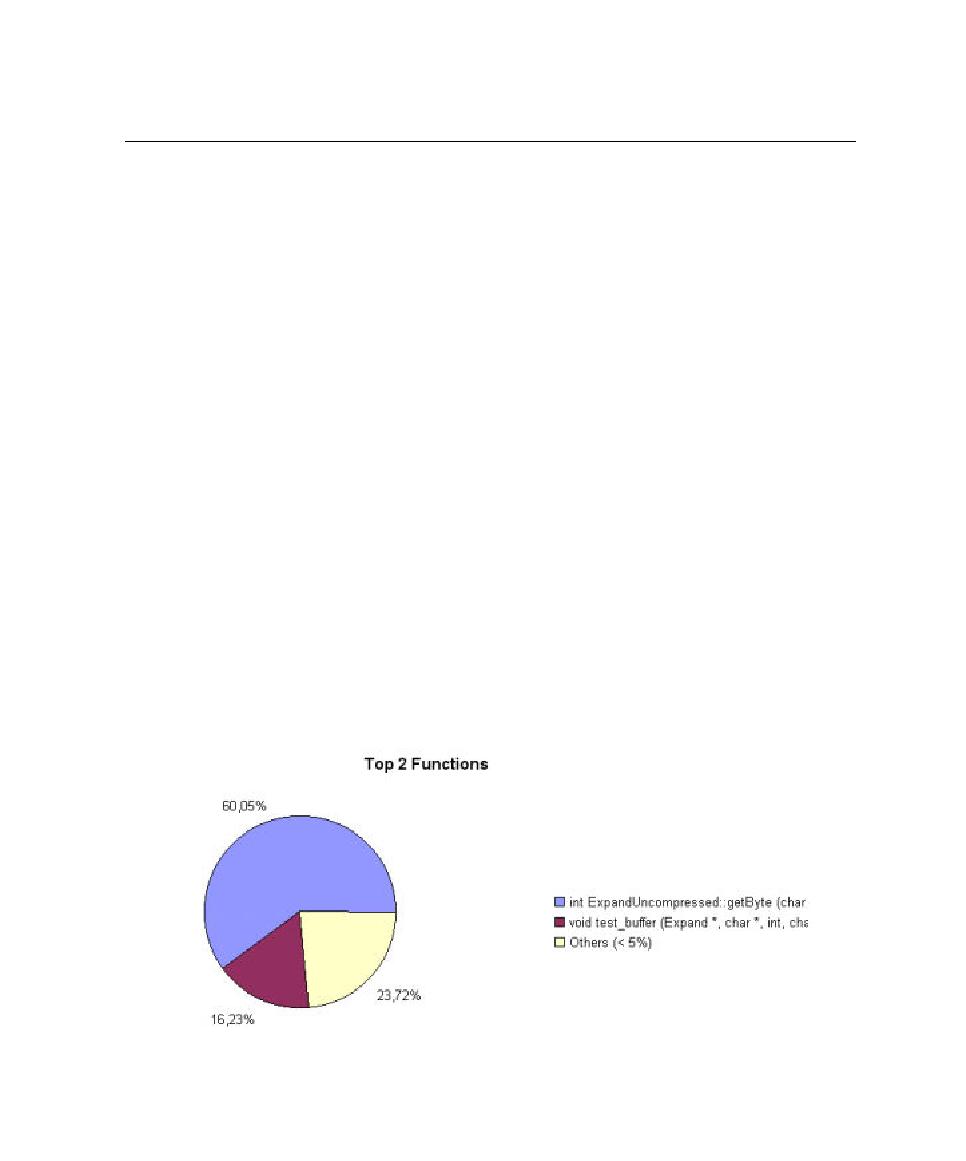
and its components so that you can see exactly where your program spends most of
its time.
detected by Performance Profiling in your application.