To configure the chart
Monitoring · Resource Monitoring
LoadRunner Controller User's Guide (Windows)
Chapter 19, page 311
To configure the chart:
1
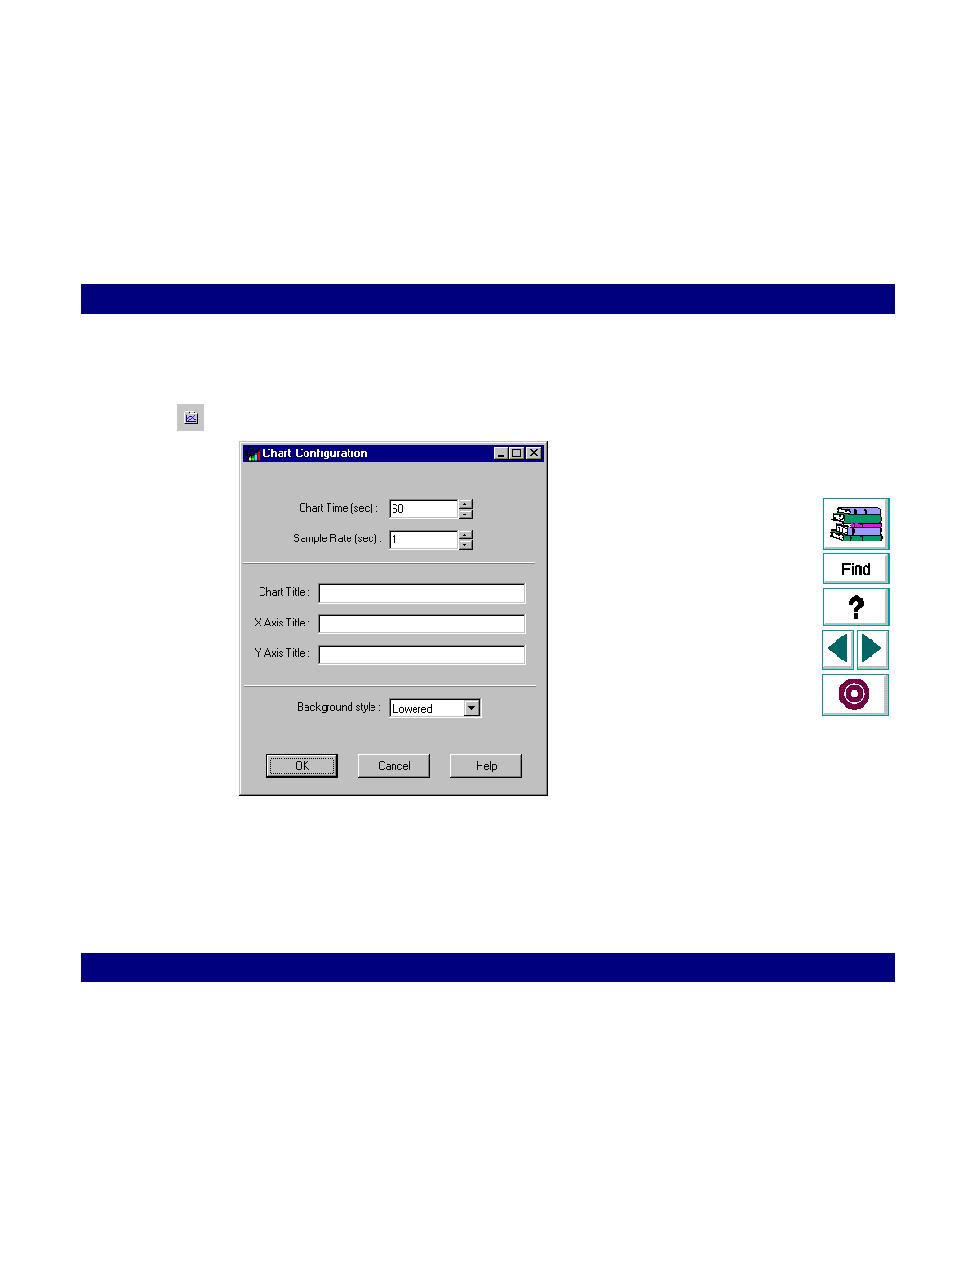
Choose Chart > Configure. The Chart Configuration dialog box opens.
2
Specify a chart time, the time in seconds displayed by the
x-axis
.
3
Enter the desired sampling rate, the time between two sequential samples.
4
Specify titles for the chart,
x-axis
, and
y-axis
.