Improving Response Time
Monitoring · Breaking Down Transactions
LoadRunner Controller User's Guide (Windows)
Chapter 18, page 289
Improving Response Time
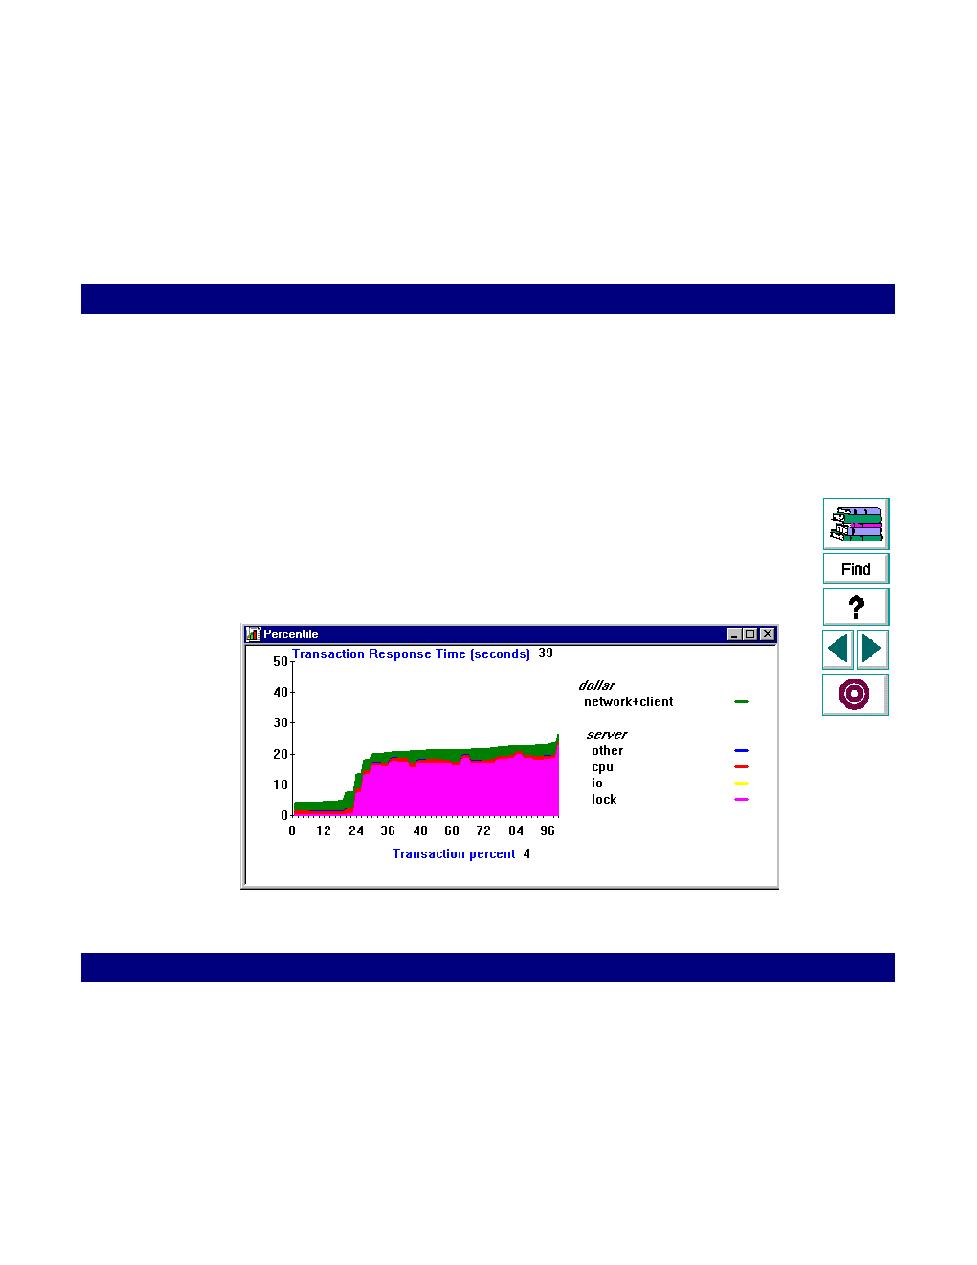
The transaction breakdown graphs show the various components of the
transaction time. The network component always appears on top. The server
components are displayed in the order of CPU, I/O, lock, latch, system locks and
general.
To best utilize the Transaction Breakdown utility, run it several times. First
determine the primary cause of delay. After solving one problem, run the scenario
again and use the breakdown utility to determine the next reason for delay.
In the following example, three scenarios were executed with the same settings
and the same number of Vusers. In the first scenario, Version 1, there was a
database locking problem.
The user corrected this by modifying the code in his application to fix the
unnecessary locks.