the number of connections
Analyzing Test Results · Web Vuser Graphs
LoadRunner Controller User's Guide (Windows)
Chapter 17, page 282
In
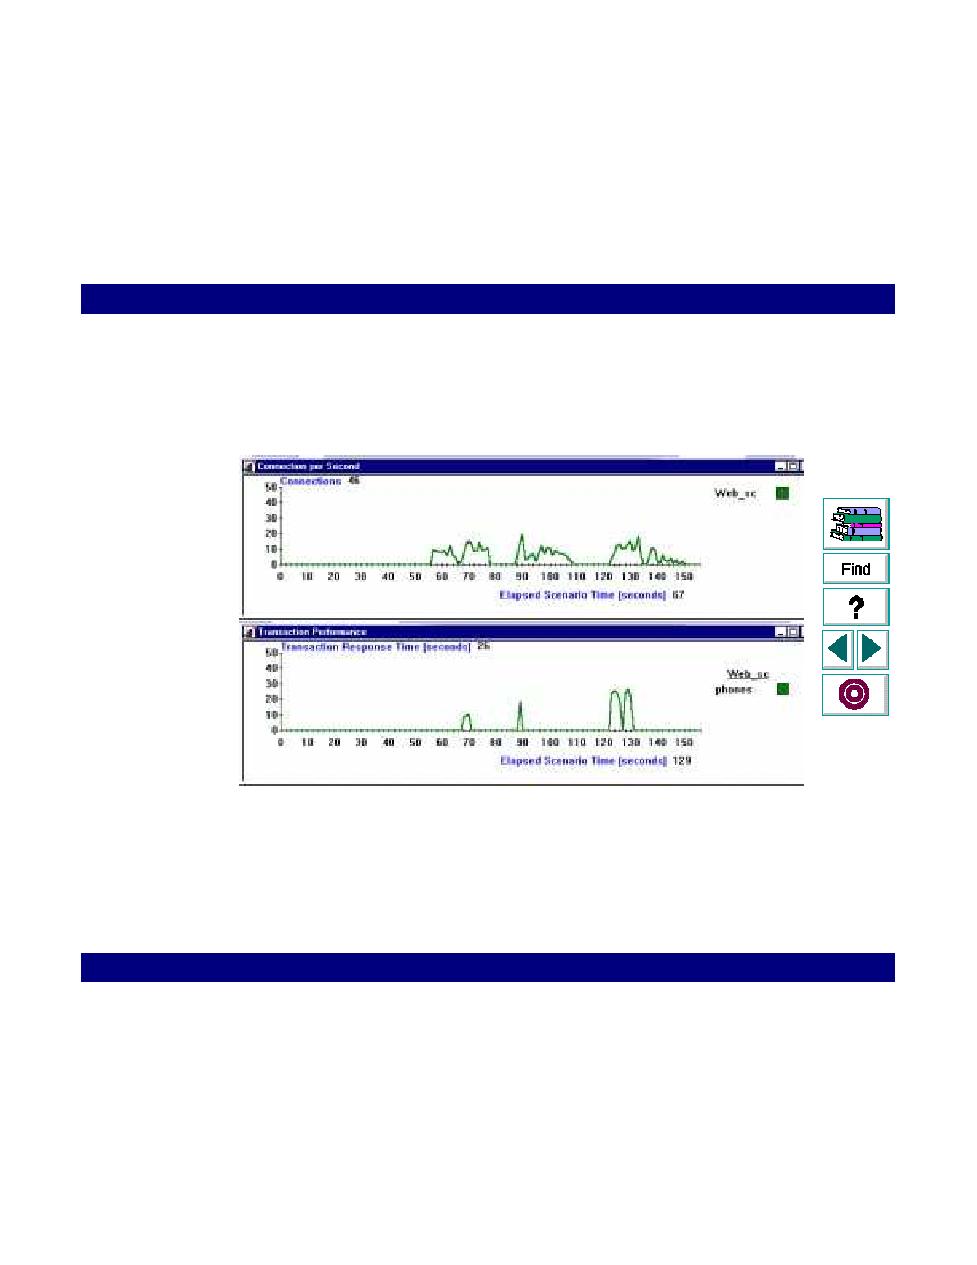
In the following example, the maximum transaction response time was 26 seconds.
This occurred when the number of connections was at its peak. This graph clearly
indicates that the response time is influenced by the number of connections.
You can compare other graphs and report results to analyze the scenario and
determine additional bottlenecks.