Cross-Scenario Analysis with Percentile Graphs
Analyzing Test Results · Cross-Scenario Analysis
LoadRunner Controller User's Guide (Windows)
Chapter 16, page 276
In
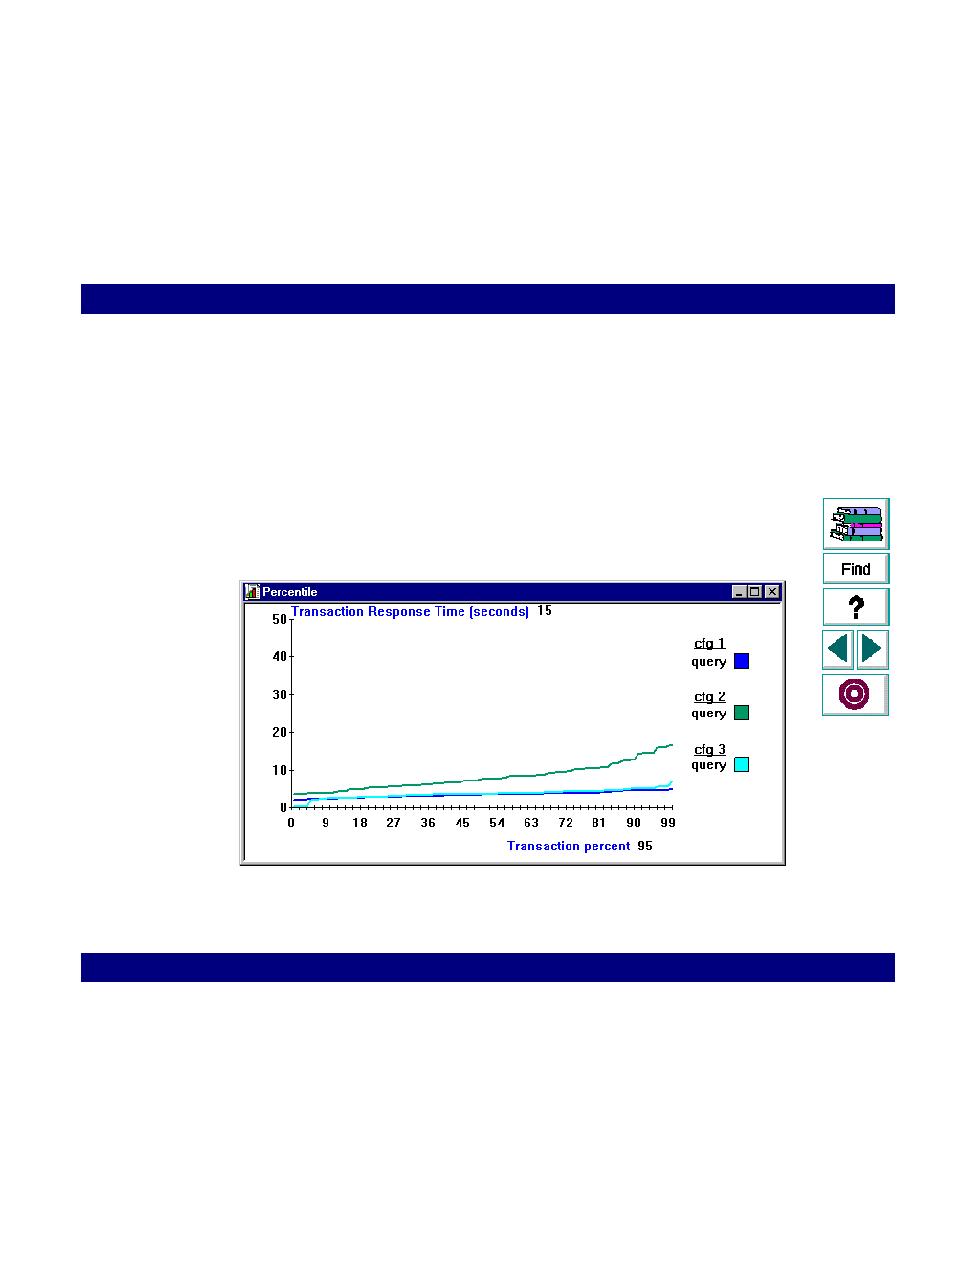
Cross-Scenario Analysis with Percentile Graphs
The Percentile graph analyzes the percentage of transactions that were
performed within a given time range. Use the Percentile cross-scenario graph to
compare the transaction response times between scenario runs.
For example, to compare transaction response time for several hardware
configurations, you run the same scenario for each configuration. Run the cross-
scenario analysis to display the transaction response times.