Cross-Scenario Analysis for Transaction Performance
Analyzing Test Results · Cross-Scenario Analysis
LoadRunner Controller User's Guide (Windows)
Chapter 16, page 272
In
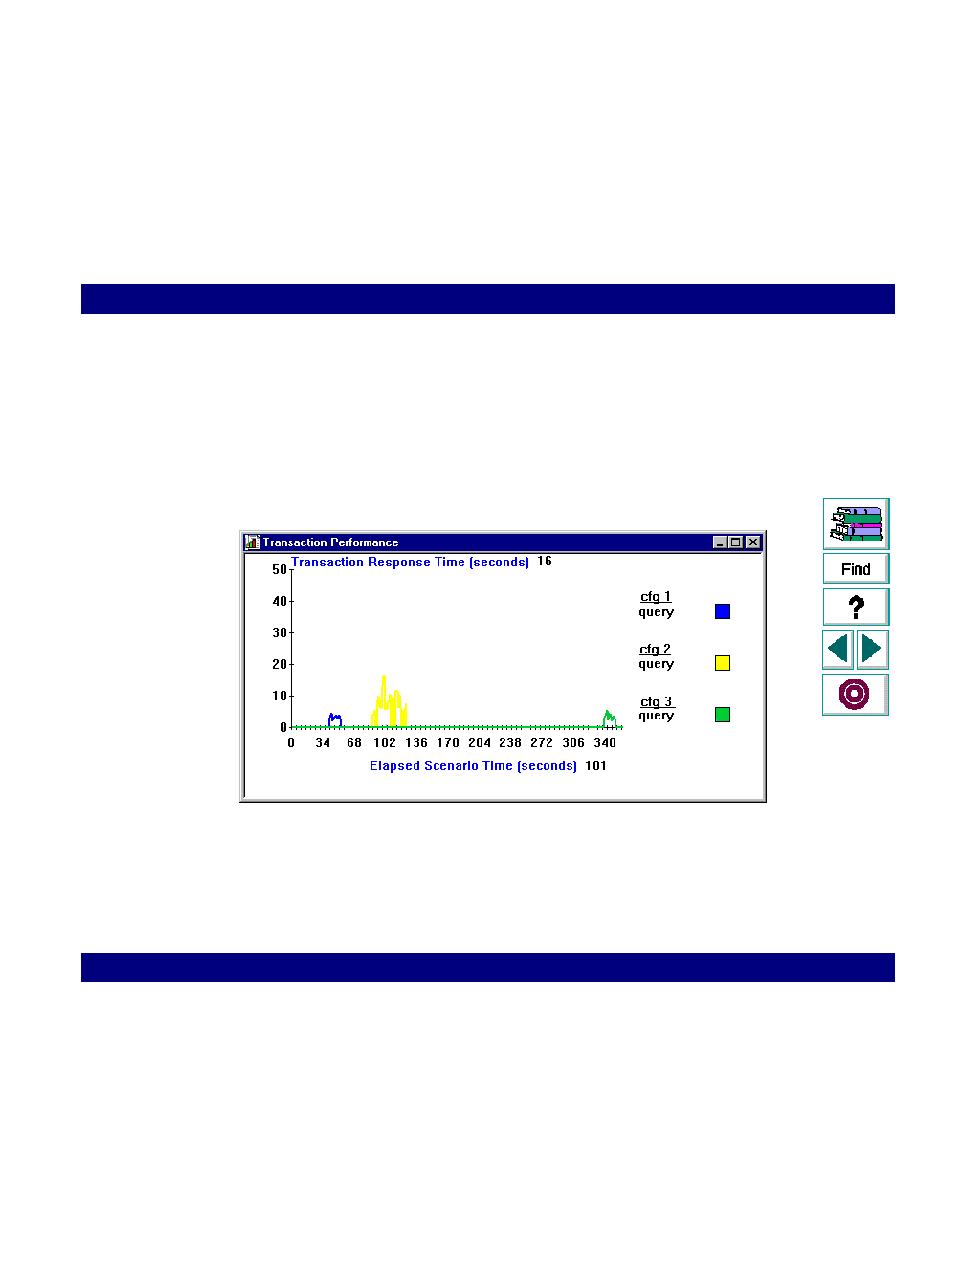
Cross-Scenario Analysis for Transaction Performance
The Transaction Performance graph displays the average time taken to perform
transactions during each second of the scenario run. Cross-scenario graphs are
useful in comparing user behavior after a configuration change such as additional
memory or CPUs. You run an identical scenario with the same number of Vusers
for each configuration. Afterwards you compare the transaction results using
cross-scenario analysis.
In the above example, the operator ran the same scenario three times, using three
different configurations. The transaction response time was substantially longer in
the second configuration. The transaction time for the second configuration was
slightly better than the third. The graph also shows that the loading time in the third
configuration was greater than the previous configurations.