The Data Point graph shows the value
Analyzing Test Results · Analyzing Scenario Performance
LoadRunner Controller User's Guide (Windows)
Chapter 15, page 263
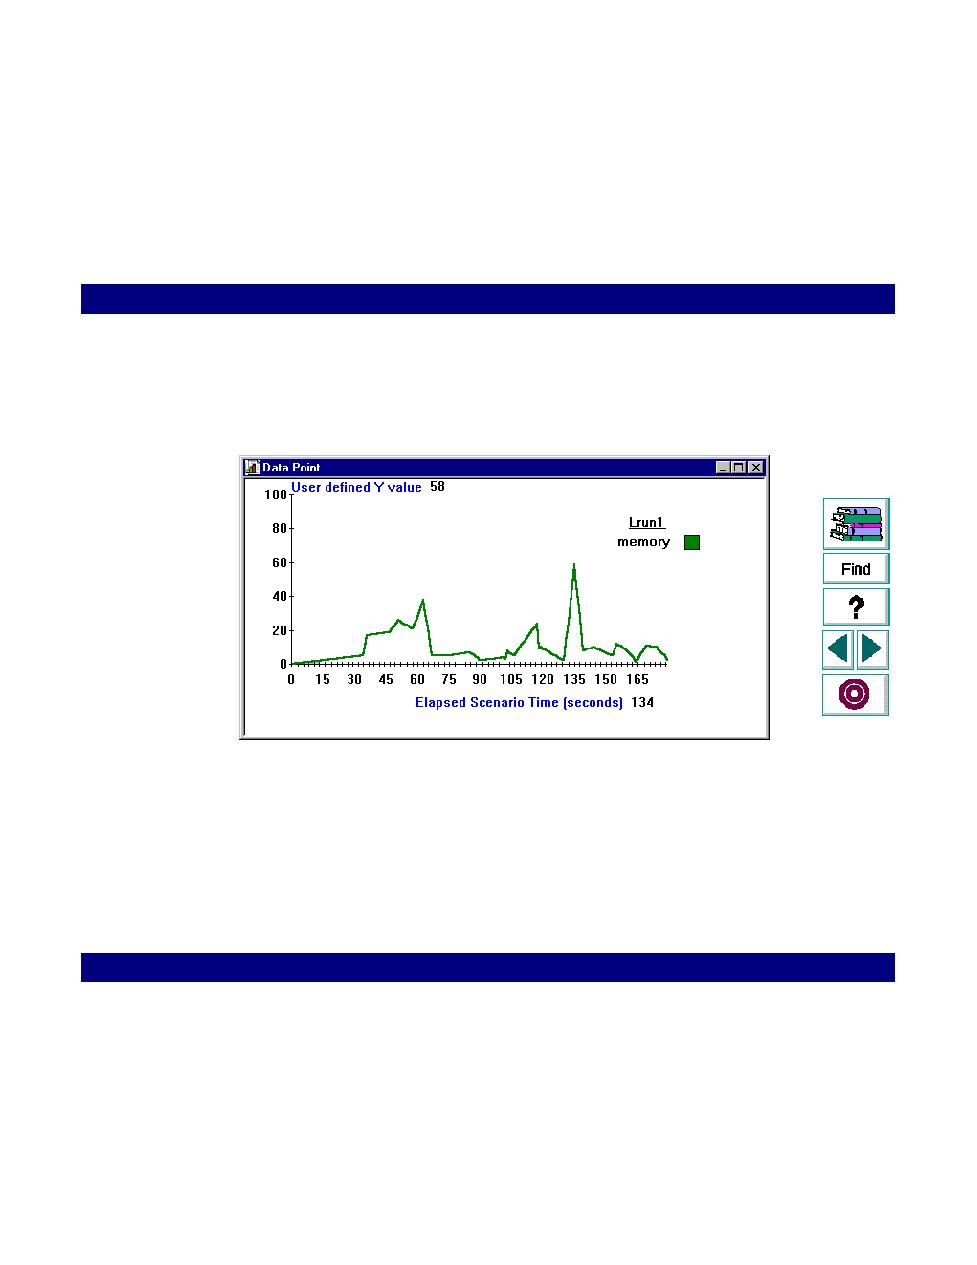
The Data Point graph shows the value of the data point during the scenario run.
The
x-
axis represents the number of seconds elapsed since the start time of the
run. The
y-axis
displays the value of each recorded data point statement.
In the above example, an lr_user_data_point statement was placed in a Vuser
script, defining a data point called
memory
. The data point is associated with an
external function that checks the computer's virtual memory. The above graph
indicates that the value of the function was 58 at the 134th second of the scenario.
You can compare this graph with other graphs to understand why and when the
peaks occurred. The peaks could indicate a rendezvous, or a transaction that uses
a great deal of memory.