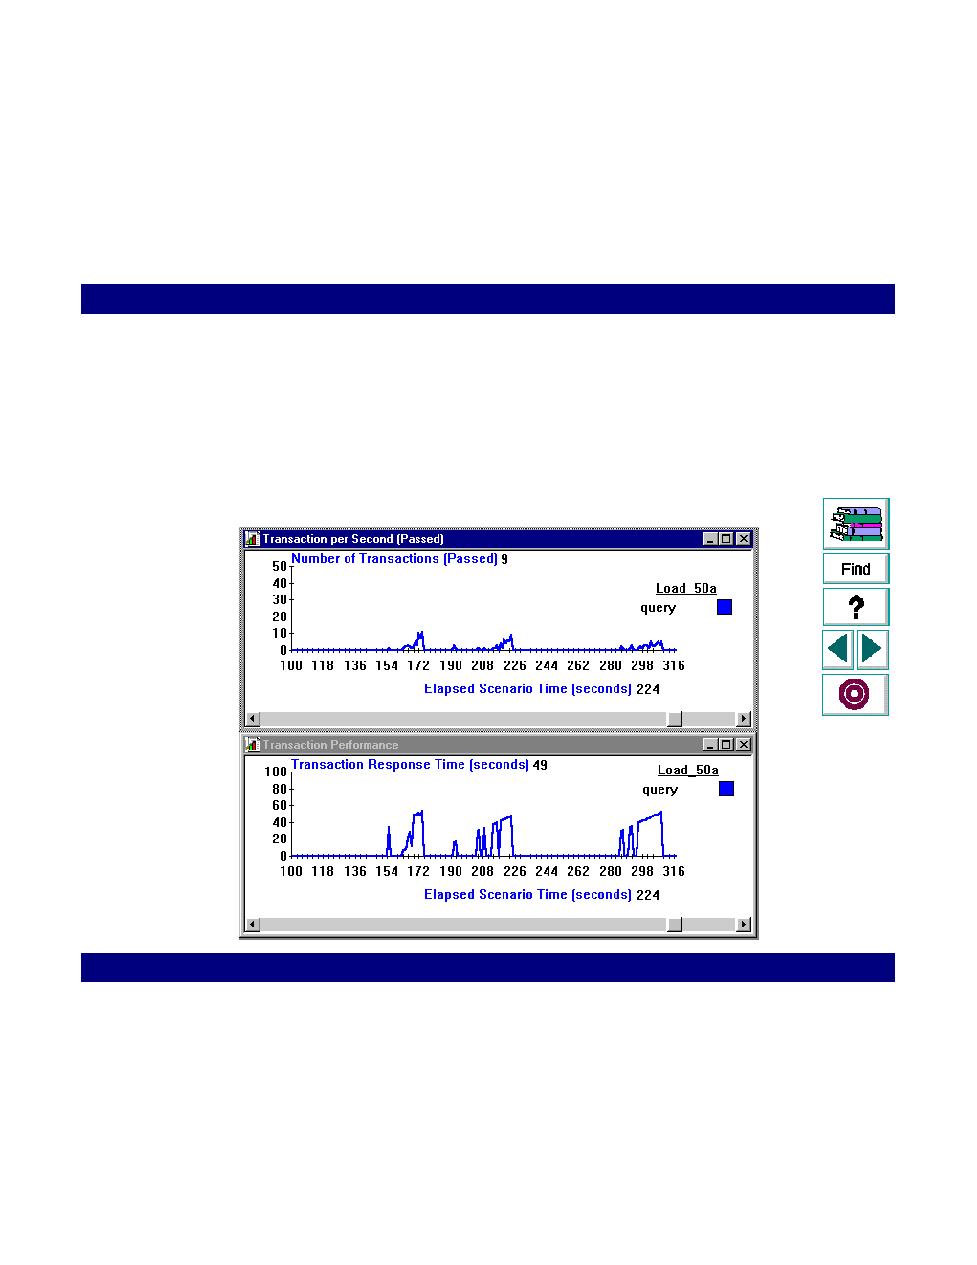
Transactions per Second Graph
successful transactions performed during each second of a scenario run. This
graph helps you determine the actual transaction load on your system at any
given moment. You can compare this graph to the Transaction Performance graph
in order to analyze the effect of the number of transactions on the performance
time.